Flex Ltd (NASDAQ:FLEX) shares are trading sharply higher Wednesday as traders react to record fiscal 2026 results and a newly approved plan to spin off its Cloud and Power Infrastructure segment, a move that ties the story more directly to AI data center demand.
Flex is also getting a fundamentals-driven bid after fourth-quarter net sales rose 17% year over year and adjusted operating margin came in at 6.7%, reinforcing why momentum traders are chasing the breakout.
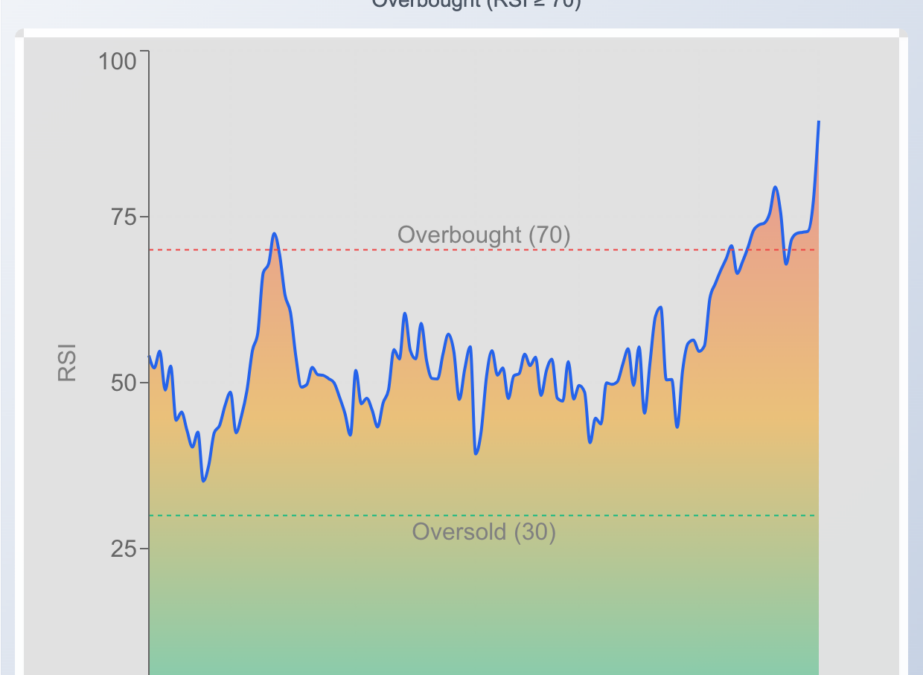
- Flex stock is at critical resistance. What’s driving FLEX to record levels?
Record Revenue Tops Analyst Estimates
Flex posted record fiscal 2026 results, with quarterly revenue of $7.48 billion beating estimates by 7.49% and adjusted EPS of 93 cents topping forecasts by 8.14%. The company also said its board unanimously approved a spin-off of its Cloud and Power Infrastructure segment into a standalone public company aimed at AI data center demand.
Flex generated $413 million in cash from operations and $212 million in free cash flow in the quarter, while full-year free cash flow totaled $1.06 billion. Management also guided Q1 FY2027 net sales to $7.35 billion–$7.65 billion and adjusted EPS to $0.86–$0.92, with full-year FY2027 net sales seen at $32.3 billion–$33.8 billion and adjusted EPS at $4.21–$4.51.
The planned Cloud and Power Infrastructure spin is being framed as a higher-growth AI infrastructure pure play, with management expecting 65% to 75% revenue growth for the new entity in fiscal 2027 and accelerating to more than 80% in fiscal 2028.
Critical Levels To Watch For FLEX Stock
Flex is in a stretched uptrend: the stock is trading 48% above its 20-day SMA ($84.81) and 100% above its 200-day SMA ($62.76), which helps explain why momentum traders are pressing the move after the news. The longer-term trend structure is still bullish, with the 20-day SMA above the 50-day SMA and a golden cross (50-day above 200-day) that occurred in June 2025.
RSI is the cleanest momentum read right now, and at 77.44 it’s overbought—meaning the stock’s recent buying pressure is getting extended and pullbacks can show up even if the primary trend stays intact. RSI first pushed into overbought territory in April, and price is now well above the prior 52-week high of $96.58, which often turns into a “new support” zone traders watch on retests.
- Key Resistance: $122.70 — price is pressing fresh highs, so the current area is the immediate breakout level to defend
- Key Support: $84.81 — aligns with the 20-day SMA, a common first “trend support” area in strong momentum runs

FLEX Benzinga Edge Rankings Explained
Below is the Benzinga Edge scorecard for Flex Ltd. Ordinary Shares, highlighting its strengths and weaknesses compared to the broader market:
- Momentum: Bullish (Score: 94.47) — The stock is outperforming the broader market, consistent with its steep distance above key moving averages.
- Quality: Bullish (Score: 91.23) — The scorecard flags strong underlying business quality, which can help support trend persistence during pullbacks.
- Value: Neutral (Score: 51.55) — Valuation looks more middle-of-the-pack on this framework, even as the stock trades at a premium P/E.
- Growth: Weak (Score: 28.81) — Growth factors screen softer here, which can matter if the market rotates away from momentum and toward fundamentals.
The Verdict: Flex’s Benzinga Edge signal reveals a momentum-led profile backed by high quality, which fits the breakout-style price action. The main pushback is the weaker growth score and an overbought RSI, so the cleaner risk management approach is often to watch whether the stock can hold recent breakout levels rather than chase extended candles.
FLEX Stock Price Action on Wednesday
FLEX Stock Price Activity: Flex shares were up 30.78% at $126.14 at the time of publication on Wednesday, according to Benzinga Pro data.
Image: Shutterstock
Recent Comments