
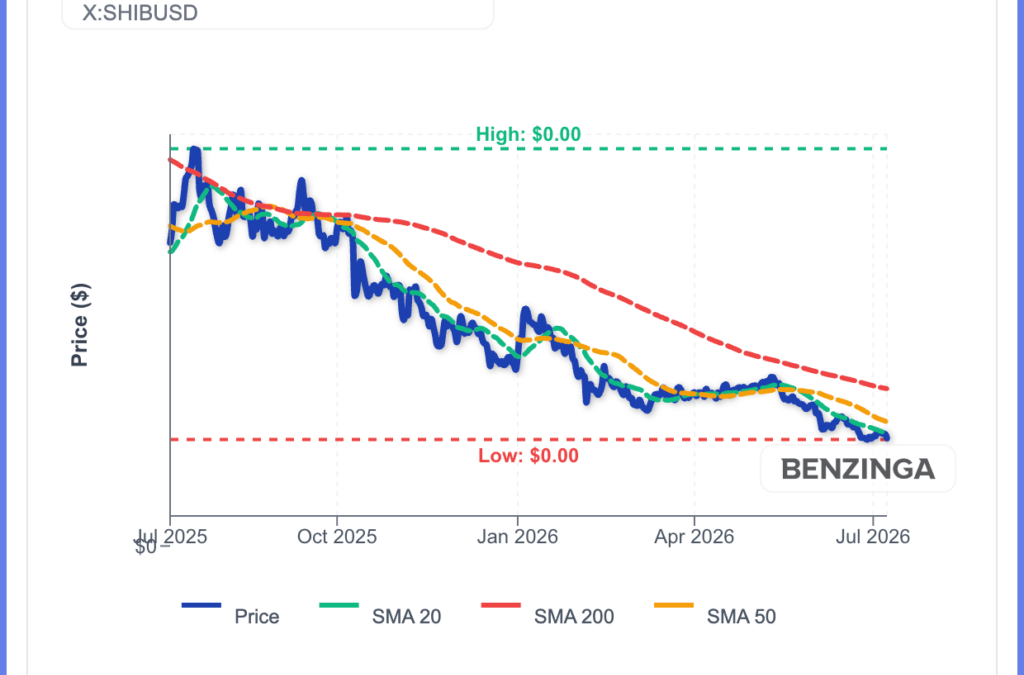
Shiba Inu (CRYPTO: SHIB) burned 117.53 million tokens on July 8, its largest single-day burn in six months, but SHIB still fell 4% as the meme coin sector hit its lowest market share since February 2024.
Why The Burn Didn’t Move The Price
The 117.53 million tokens burned Tuesday translated to roughly $517 in value destroyed, a number that looks large in token count but tiny relative to SHIB’s total circulating supply.
Over the past 30 days, the community burned 228.31 million tokens worth just $1,021 combined, confirming the burns are generating social media buzz without creating any meaningful supply pressure on price.
CoinDesk data shows meme coins have fallen to just 3.7% of total altcoin market cap, down from a peak above 10% during November 2024’s meme coin season and the lowest share since February 2024.
Meanwhile, SHIB is down nearly 9% over the past month despite the burn activity.
Derivatives Show Bulls Getting Punished On Every Bounce
Open interest dropped 9.13% to $26.67 million, near multi-year lows, while volume spiked 29.92% Tuesday.
That combination points to traders paying attention in the short term without actually committing real money to the move.
The long/short ratio looks almost even at 0.9543, but the liquidation numbers tell a different story.
Bulls lost $191.36 thousand in forced liquidations over the past 24 hours while bears lost just $7.64 thousand. Every time SHIB bounces, the buyers are getting squeezed out before any rally can stick.
Coins are also leaving exchanges, which normally signals holders pulling back rather than selling. The problem is no fresh buying is replacing them. Until open interest starts climbing alongside price, any move higher lacks the fuel to sustain itself.
RSI Divergence Is The One Signal Worth Watching

SHIB trades at $0.00000420, locked in a descending channel since late May and below all four EMAs in a fully bearish stack.
The standout signal is an RSI bull divergence, where price printed a lower low in July while RSI printed a higher low at 32.10. The same setup preceded the April to May recovery rally.
A daily close above the 20 EMA at $0.00000444 would be the first early sign of a momentum shift.
Until that confirms, the divergence alone is not a trigger. Resistance sits at the 50 EMA at $0.00000483 and the 100 EMA at $0.00000534, with $0.00000400 as the channel floor and psychological support below.
Image: Shutterstock
Recent Comments