
In today’s rapidly evolving and fiercely competitive business landscape, it is crucial for investors and industry analysts to conduct comprehensive company evaluations. In this article, we will undertake an in-depth industry comparison, assessing AT&T (NYSE:T) alongside its primary competitors in the Diversified Telecommunication Services industry. By meticulously examining crucial financial indicators, market positioning, and growth potential, we aim to provide valuable insights to investors and shed light on company’s performance within the industry.
AT&T Background
The wireless business contributes nearly 70% of AT&T’s revenue. The company is the third-largest US wireless carrier, connecting 74 million postpaid and 17 million prepaid phone customers. Fixed-line enterprise services, which account for about 14% of revenue, include internet access, private networking, security, voice, and wholesale network capacity. Residential services, about 11% of revenue, primarily consist of in-home broadband internet access, serving 15 million customers. AT&T also has a sizable presence in Mexico, with 25 million wireless customers, but this business only accounts for 3% of revenue. The company recently sold its 70% equity stake in satellite television provider DirecTV to its partner, private equity firm TPG.
| Company | P/E | P/B | P/S | ROE | EBITDA (in billions) | Gross Profit (in billions) | Revenue Growth |
|---|---|---|---|---|---|---|---|
| AT&T Inc | 6.93 | 1.30 | 1.16 | 3.45% | $12.18 | $18.94 | 2.87% |
| Verizon Communications Inc | 10.38 | 1.72 | 1.29 | 4.86% | $13.62 | $20.77 | 2.85% |
| Comcast Corp | 4.66 | 0.96 | 0.70 | 2.35% | $7.69 | $20.57 | 5.25% |
| BCE Inc | 4.49 | 1.41 | 1.15 | 3.09% | $2.71 | $4.21 | 4.01% |
| TELUS Corp | 24.11 | 1.45 | 1.10 | 0.87% | $1.58 | $3.13 | -0.58% |
| Tutor Perini Corp | 52.57 | 3.33 | 0.72 | 2.11% | $0.08 | $0.15 | 11.46% |
| Uniti Group Inc | 2.42 | 8.16 | 1.08 | -24.51% | $0.41 | $0.6 | 236.0% |
| IDT Corp | 18.04 | 4.09 | 1.16 | 6.2% | $0.03 | $0.12 | 4.55% |
| Average | 16.67 | 3.02 | 1.03 | -0.72% | $3.73 | $7.08 | 37.65% |
Upon closer analysis of AT&T, the following trends become apparent:
-
The Price to Earnings ratio of 6.93 is 0.42x lower than the industry average, indicating potential undervaluation for the stock.
-
With a Price to Book ratio of 1.3, significantly falling below the industry average by 0.43x, it suggests undervaluation and the possibility of untapped growth prospects.
-
With a relatively high Price to Sales ratio of 1.16, which is 1.13x the industry average, the stock might be considered overvalued based on sales performance.
-
With a Return on Equity (ROE) of 3.45% that is 4.17% above the industry average, it appears that the company exhibits efficient use of equity to generate profits.
-
The company exhibits higher Earnings Before Interest, Taxes, Depreciation, and Amortization (EBITDA) of $12.18 Billion, which is 3.27x above the industry average, implying stronger profitability and robust cash flow generation.
-
Compared to its industry, the company has higher gross profit of $18.94 Billion, which indicates 2.68x above the industry average, indicating stronger profitability and higher earnings from its core operations.
-
The company’s revenue growth of 2.87% is significantly below the industry average of 37.65%. This suggests a potential struggle in generating increased sales volume.
Debt To Equity Ratio

The debt-to-equity (D/E) ratio is an important measure to assess the financial structure and risk profile of a company.
Considering the debt-to-equity ratio in industry comparisons allows for a concise evaluation of a company’s financial health and risk profile, aiding in informed decision-making.
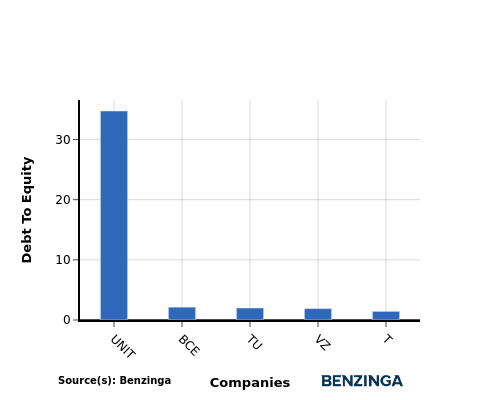
In light of the Debt-to-Equity ratio, a comparison between AT&T and its top 4 peers reveals the following information:
-
When considering the debt-to-equity ratio, AT&T exhibits a stronger financial position compared to its top 4 peers.
-
This indicates that the company has a favorable balance between debt and equity, with a lower debt-to-equity ratio of 1.43, which can be perceived as a positive aspect by investors.
Key Takeaways
For AT&T in the Diversified Telecommunication Services industry, the PE and PB ratios suggest the stock is undervalued compared to peers, while the PS ratio indicates overvaluation. In terms of ROE, EBITDA, and gross profit, AT&T outperforms industry peers, indicating strong profitability. However, the low revenue growth rate may be a concern for the company’s future performance relative to competitors.
This article was generated by Benzinga’s automated content engine and reviewed by an editor.
Recent Comments