In today’s rapidly changing and highly competitive business world, it is vital for investors and industry enthusiasts to carefully assess companies. In this article, we will perform a comprehensive industry comparison, evaluating Coeur Mining (NYSE:CDE) against its key competitors in the Metals & Mining industry. By analyzing important financial metrics, market position, and growth prospects, we aim to provide valuable insights for investors and shed light on company’s performance within the industry.
Coeur Mining Background
Coeur Mining Inc is a metals producer focused on mining precious minerals in the Americas. It is involved in the discovery and mining of gold and silver and generates the vast majority of revenue from the sale of these precious metals. The operating mines of the company are palmarejo, Rochester, Wharf, and Kensington. Its projects are located in the United States, Canada, and Mexico generating maximum revenue from United States.
| Company | P/E | P/B | P/S | ROE | EBITDA (in billions) | Gross Profit (in billions) | Revenue Growth |
|---|---|---|---|---|---|---|---|
| Coeur Mining Inc | 13.16 | 1.62 | 4.19 | 3.6% | $0.45 | $0.43 | 137.79% |
| Newmont Corp | 12.11 | 2.85 | 4.11 | 9.48% | $5.25 | $4.74 | 45.85% |
| Agnico Eagle Mines Ltd | 14.61 | 2.95 | 5.76 | 6.65% | $3.0 | $2.72 | 66.09% |
| Wheaton Precious Metals Corp | 28.39 | 5.52 | 18.61 | 6.49% | $0.77 | $0.7 | 91.63% |
| Anglogold Ashanti PLC | 11.88 | 4.79 | 3.70 | 15.41% | $2.04 | $1.94 | 64.85% |
| Kinross Gold Corp | 10.05 | 3.10 | 3.61 | 9.54% | $1.6 | $1.44 | 60.78% |
| Pan American Silver Corp | 14.13 | 2.57 | 4.44 | 6.37% | $0.78 | $0.61 | 49.29% |
| Royal Gold Inc | 24.14 | 2.28 | 11.36 | 3.86% | $0.41 | $0.31 | 142.52% |
| Alamos Gold Inc | 12.09 | 2.77 | 6.21 | 4.23% | $0.39 | $0.39 | 79.19% |
| Iamgold Corp | 9.26 | 2.11 | 2.72 | 8.91% | $0.65 | $0.57 | 115.91% |
| Eldorado Gold Corp | 10.87 | 1.88 | 3.20 | 3.17% | $0.32 | $0.29 | 49.88% |
| Equinox Gold Corp | 26.27 | 1.25 | 2.91 | 5.2% | $0.46 | $0.44 | 224.27% |
| Triple Flag Precious Metals Corp | 19.85 | 2.88 | 13.59 | 5.58% | $0.15 | $0.11 | 78.73% |
| OR Royalties Inc | 23.60 | 4.03 | 18.40 | 5.07% | $0.1 | $0.09 | 87.25% |
| SSR Mining Inc | 10.84 | 1.62 | 3.24 | -2.98% | $0.34 | $0.36 | 83.75% |
| OceanaGold Corp | 7.65 | 2.35 | 2.57 | 9.81% | $0.42 | $0.4 | 98.53% |
| Aura Minerals Inc | 56.21 | 17.41 | 4.47 | 33.53% | $0.18 | $0.23 | 136.46% |
| B2Gold Corp | 9.84 | 1.39 | 1.51 | 5.5% | $0.52 | $0.61 | 117.75% |
| Orla Mining Ltd | 13.60 | 4.86 | 2.80 | 10.68% | $0.2 | $0.22 | 169.34% |
| Centerra Gold Inc | 5.12 | 1.50 | 2.05 | 3.82% | $0.17 | $0.2 | 61.83% |
| Aris Mining Corp | 17.14 | 1.96 | 2.62 | 6.47% | $0.19 | $0.22 | 136.45% |
| Average | 16.88 | 3.5 | 5.89 | 7.84% | $0.9 | $0.83 | 98.02% |
By closely studying Coeur Mining, we can observe the following trends:
-
A Price to Earnings ratio of 13.16 significantly below the industry average by 0.78x suggests undervaluation. This can make the stock appealing for those seeking growth.
-
With a Price to Book ratio of 1.62, significantly falling below the industry average by 0.46x, it suggests undervaluation and the possibility of untapped growth prospects.
-
With a relatively low Price to Sales ratio of 4.19, which is 0.71x the industry average, the stock might be considered undervalued based on sales performance.
-
The company has a lower Return on Equity (ROE) of 3.6%, which is 4.24% below the industry average. This indicates potential inefficiency in utilizing equity to generate profits, which could be attributed to various factors.
-
The company has lower Earnings Before Interest, Taxes, Depreciation, and Amortization (EBITDA) of $450 Million, which is 0.5x below the industry average. This potentially indicates lower profitability or financial challenges.
-
With lower gross profit of $430 Million, which indicates 0.52x below the industry average, the company may experience lower revenue after accounting for production costs.
-
The company’s revenue growth of 137.79% is notably higher compared to the industry average of 98.02%, showcasing exceptional sales performance and strong demand for its products or services.
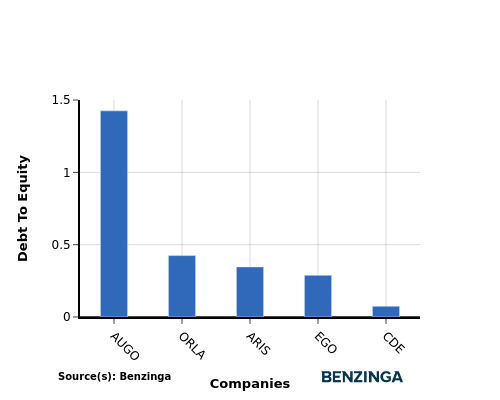
Debt To Equity Ratio

The debt-to-equity (D/E) ratio provides insights into the proportion of debt a company has in relation to its equity and asset value.
Considering the debt-to-equity ratio in industry comparisons allows for a concise evaluation of a company’s financial health and risk profile, aiding in informed decision-making.
When comparing Coeur Mining with its top 4 peers based on the Debt-to-Equity ratio, the following insights can be observed:
-
When considering the debt-to-equity ratio, Coeur Mining exhibits a stronger financial position compared to its top 4 peers.
-
This indicates that the company has a favorable balance between debt and equity, with a lower debt-to-equity ratio of 0.07, which can be perceived as a positive aspect by investors.
Key Takeaways
For Coeur Mining in the Metals & Mining industry, the PE, PB, and PS ratios are all low compared to peers, indicating potential undervaluation. However, the low ROE, EBITDA, and gross profit suggest lower profitability levels. On the positive side, the high revenue growth rate stands out, showing strong potential for future performance compared to industry peers.
This article was generated by Benzinga’s automated content engine and reviewed by an editor.
Recent Comments