In the dynamic and fiercely competitive business environment, conducting a thorough analysis of companies is crucial for investors and industry enthusiasts. In this article, we will perform an extensive industry comparison, evaluating Marvell Technology (NASDAQ:MRVL) in relation to its major competitors in the Semiconductors & Semiconductor Equipment industry. By closely examining crucial financial metrics, market position, and growth prospects, we aim to offer valuable insights for investors and shed light on company’s performance within the industry.
Marvell Technology Background
Marvell Technology is a fabless chip designer focused on wired networking, where it has the second-highest market share. Marvell serves the data center, carrier, enterprise, and consumer end markets with processors, optical and copper transceivers, switches, and storage controllers.
| Company | P/E | P/B | P/S | ROE | EBITDA (in billions) | Gross Profit (in billions) | Revenue Growth |
|---|---|---|---|---|---|---|---|
| Marvell Technology Inc | 95.89 | 13.40 | 27.98 | 0.21% | $0.66 | $1.26 | 27.57% |
| NVIDIA Corp | 30.63 | 24.79 | 19.30 | 33.06% | $71.0 | $61.16 | 85.23% |
| Broadcom Inc | 63.25 | 20.62 | 24.58 | 11.11% | $13.07 | $15.41 | 47.87% |
| Micron Technology Inc | 49.64 | 16.37 | 20.51 | 21.0% | $18.48 | $17.75 | 196.29% |
| Advanced Micro Devices Inc | 173.28 | 13.15 | 22.79 | 2.17% | $2.4 | $5.42 | 37.85% |
| Texas Instruments Inc | 52.03 | 16.51 | 15.06 | 9.35% | $2.42 | $2.8 | 18.58% |
| Qualcomm Inc | 21.95 | 7.89 | 4.97 | 29.27% | $2.82 | $5.7 | -3.46% |
| Analog Devices Inc | 60.60 | 5.88 | 15.76 | 3.48% | $1.9 | $2.44 | 37.25% |
| NXP Semiconductors NV | 28.67 | 6.93 | 6.04 | 10.69% | $1.7 | $1.79 | 12.2% |
| Monolithic Power Systems Inc | 101.92 | 19.02 | 23.41 | 5.36% | $0.26 | $0.45 | 26.14% |
| Credo Technology Group Holding Ltd | 108.37 | 24.58 | 38.35 | 8.64% | $0.17 | $0.3 | 157.02% |
| Microchip Technology Inc | 423.91 | 7.86 | 10.79 | 1.79% | $0.39 | $0.8 | 35.11% |
| ON Semiconductor Corp | 86.07 | 6.23 | 7.82 | -0.45% | $0.25 | $0.58 | 4.68% |
| Tower Semiconductor Ltd | 130.90 | 10.67 | 19.86 | 2.2% | $0.15 | $0.11 | 15.48% |
| MACOM Technology Solutions Holdings Inc | 158.36 | 20.03 | 26.26 | 3.34% | $0.07 | $0.16 | 22.5% |
| First Solar Inc | 16.10 | 2.71 | 4.95 | 3.57% | $0.51 | $0.49 | 23.64% |
| Lattice Semiconductor Corp | 1033.86 | 26.79 | 34.93 | 3.0% | $0.04 | $0.12 | 42.24% |
| Average | 158.72 | 14.38 | 18.46 | 9.22% | $7.23 | $7.22 | 47.41% |
By carefully studying Marvell Technology, we can deduce the following trends:
-
The Price to Earnings ratio of 95.89 is 0.6x lower than the industry average, indicating potential undervaluation for the stock.
-
Considering a Price to Book ratio of 13.4, which is well below the industry average by 0.93x, the stock may be undervalued based on its book value compared to its peers.
-
The stock’s relatively high Price to Sales ratio of 27.98, surpassing the industry average by 1.52x, may indicate an aspect of overvaluation in terms of sales performance.
-
The Return on Equity (ROE) of 0.21% is 9.01% below the industry average, suggesting potential inefficiency in utilizing equity to generate profits.
-
With lower Earnings Before Interest, Taxes, Depreciation, and Amortization (EBITDA) of $660 Million, which is 0.09x below the industry average, the company may face lower profitability or financial challenges.
-
With lower gross profit of $1.26 Billion, which indicates 0.17x below the industry average, the company may experience lower revenue after accounting for production costs.
-
The company’s revenue growth of 27.57% is significantly lower compared to the industry average of 47.41%. This indicates a potential fall in the company’s sales performance.
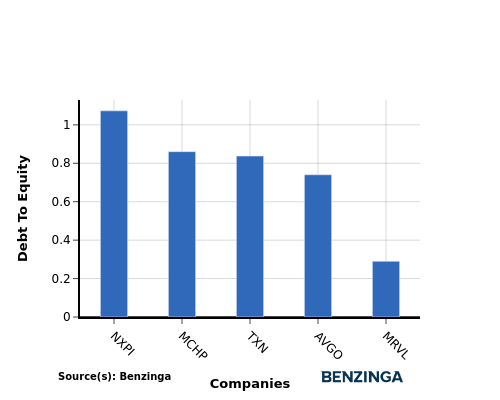
Debt To Equity Ratio
The debt-to-equity (D/E) ratio is an important measure to assess the financial structure and risk profile of a company.
Considering the debt-to-equity ratio in industry comparisons allows for a concise evaluation of a company’s financial health and risk profile, aiding in informed decision-making.
When assessing Marvell Technology against its top 4 peers using the Debt-to-Equity ratio, the following comparisons can be made:
-
Marvell Technology has a stronger financial position compared to its top 4 peers, as evidenced by its lower debt-to-equity ratio of 0.29.
-
This suggests that the company has a more favorable balance between debt and equity, which can be perceived as a positive indicator by investors.
Key Takeaways
For Marvell Technology in the Semiconductors & Semiconductor Equipment industry, the PE and PB ratios are low compared to peers, indicating potential undervaluation. However, the high PS ratio suggests overvaluation based on revenue. In terms of ROE, EBITDA, gross profit, and revenue growth, Marvell Technology lags behind its industry peers, reflecting weaker financial performance and growth prospects.
This article was generated by Benzinga’s automated content engine and reviewed by an editor.
Recent Comments