In today’s rapidly changing and highly competitive business world, it is vital for investors and industry enthusiasts to carefully assess companies. In this article, we will perform a comprehensive industry comparison, evaluating Analog Devices (NASDAQ:ADI) against its key competitors in the Semiconductors & Semiconductor Equipment industry. By analyzing important financial metrics, market position, and growth prospects, we aim to provide valuable insights for investors and shed light on company’s performance within the industry.
Analog Devices Background
Analog Devices is a leading analog, mixed-signal, and digital-signal processing chipmaker. The firm has a significant market share lead in converter chips, which are used to translate analog signals to digital and vice versa. The company serves tens of thousands of customers; more than half of its chip sales are to industrial and automotive end markets. ADI’s chips are also incorporated into wireless infrastructure equipment.
| Company | P/E | P/B | P/S | ROE | EBITDA (in billions) | Gross Profit (in billions) | Revenue Growth |
|---|---|---|---|---|---|---|---|
| Analog Devices Inc | 60.21 | 5.84 | 15.66 | 3.48% | $1.9 | $2.44 | 37.25% |
| NVIDIA Corp | 31.88 | 25.80 | 20.09 | 33.06% | $71.0 | $61.16 | 85.23% |
| Broadcom Inc | 65.25 | 21.28 | 25.35 | 9.12% | $11.15 | $13.16 | 29.47% |
| Micron Technology Inc | 44.17 | 14.57 | 18.25 | 21.0% | $18.48 | $17.75 | 196.29% |
| Advanced Micro Devices Inc | 158.50 | 12.03 | 20.85 | 2.17% | $2.4 | $5.42 | 37.85% |
| Texas Instruments Inc | 49.34 | 15.66 | 14.28 | 9.35% | $2.42 | $2.8 | 18.58% |
| Marvell Technology Inc | 91.71 | 12.82 | 26.76 | 0.21% | $0.66 | $1.26 | 27.57% |
| Qualcomm Inc | 22.09 | 7.94 | 5 | 29.27% | $2.82 | $5.7 | -3.46% |
| NXP Semiconductors NV | 28.43 | 6.87 | 5.99 | 10.69% | $1.7 | $1.79 | 12.2% |
| Monolithic Power Systems Inc | 109.66 | 20.47 | 25.19 | 5.36% | $0.26 | $0.45 | 26.14% |
| Microchip Technology Inc | 415.77 | 7.71 | 10.58 | 1.79% | $0.39 | $0.8 | 35.11% |
| ON Semiconductor Corp | 86.03 | 6.23 | 7.82 | -0.45% | $0.25 | $0.58 | 4.68% |
| Credo Technology Group Holding Ltd | 128.75 | 23.38 | 40.75 | 10.03% | $0.16 | $0.28 | 201.49% |
| First Solar Inc | 16.94 | 2.85 | 5.21 | 3.57% | $0.51 | $0.49 | 23.64% |
| MACOM Technology Solutions Holdings Inc | 152.65 | 19.30 | 25.32 | 3.34% | $0.07 | $0.16 | 22.5% |
| Tower Semiconductor Ltd | 105.57 | 8.61 | 16.02 | 2.2% | $0.15 | $0.11 | 15.48% |
| Lattice Semiconductor Corp | 983 | 25.47 | 33.21 | 3.0% | $0.04 | $0.12 | 42.24% |
| Average | 155.61 | 14.44 | 18.79 | 8.98% | $7.03 | $7.0 | 48.44% |
By conducting an in-depth analysis of Analog Devices, we can identify the following trends:
-
A Price to Earnings ratio of 60.21 significantly below the industry average by 0.39x suggests undervaluation. This can make the stock appealing for those seeking growth.
-
Considering a Price to Book ratio of 5.84, which is well below the industry average by 0.4x, the stock may be undervalued based on its book value compared to its peers.
-
The Price to Sales ratio is 15.66, which is 0.83x the industry average. This suggests a possible undervaluation based on sales performance.
-
The company has a lower Return on Equity (ROE) of 3.48%, which is 5.5% below the industry average. This indicates potential inefficiency in utilizing equity to generate profits, which could be attributed to various factors.
-
With lower Earnings Before Interest, Taxes, Depreciation, and Amortization (EBITDA) of $1.9 Billion, which is 0.27x below the industry average, the company may face lower profitability or financial challenges.
-
With lower gross profit of $2.44 Billion, which indicates 0.35x below the industry average, the company may experience lower revenue after accounting for production costs.
-
With a revenue growth of 37.25%, which is much lower than the industry average of 48.44%, the company is experiencing a notable slowdown in sales expansion.
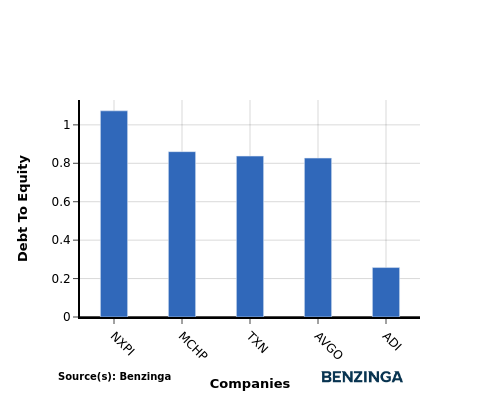
Debt To Equity Ratio

The debt-to-equity (D/E) ratio is an important measure to assess the financial structure and risk profile of a company.
Considering the debt-to-equity ratio in industry comparisons allows for a concise evaluation of a company’s financial health and risk profile, aiding in informed decision-making.
When comparing Analog Devices with its top 4 peers based on the Debt-to-Equity ratio, the following insights can be observed:
-
When considering the debt-to-equity ratio, Analog Devices exhibits a stronger financial position compared to its top 4 peers.
-
This indicates that the company has a favorable balance between debt and equity, with a lower debt-to-equity ratio of 0.26, which can be perceived as a positive aspect by investors.
Key Takeaways
For Analog Devices, the PE, PB, and PS ratios are all low compared to industry peers, indicating potential undervaluation. However, the low ROE, EBITDA, gross profit, and revenue growth suggest weaker financial performance relative to competitors in the Semiconductors & Semiconductor Equipment sector. This may warrant further investigation into the company’s operational efficiency and growth strategies.
This article was generated by Benzinga’s automated content engine and reviewed by an editor.
Recent Comments