SoFi Technologies Inc (NASDAQ:SOFI) shares are edging higher on Monday as risk appetite is improving and traders continue to digest the company’s recent stablecoin rollout and macro conditions.
- SoFi Technologies stock is building positive momentum. Why are SOFI shares climbing?
What Is SoFiUSD And Its Impact On SOFI?
SoFi recently rolled out SoFiUSD, which it describes as the first time a U.S. national bank-issued stablecoin is available directly inside a banking app, with access expanded to nearly 15 million members. The product is positioned as a “bank-grade,” 1:1 redeemable U.S. dollar stablecoin on a public blockchain, and it has helped keep attention on SoFi’s broader product funnel.
SoFiUSD is now available for members to buy, sell, hold and convert directly in the SoFi app, keeping the stock sensitive to crypto-adjacent sentiment swings even when the broader tape is doing the heavy lifting. Traders have also been quick to fade the initial move at times, treating the rollout as a near-term catalyst rather than a full re-rating event.
In parallel, retail-trading chatter has been getting a boost from SpaceX IPO prospectus language circulating about up to 30% of shares potentially allocated to retail, well above the typical retail slice, an angle that can temporarily lift expectations for brokerage engagement. That matters for SOFI because IPO-access headlines can pull more activity into brokerage funnels even before any deal timeline is clear.
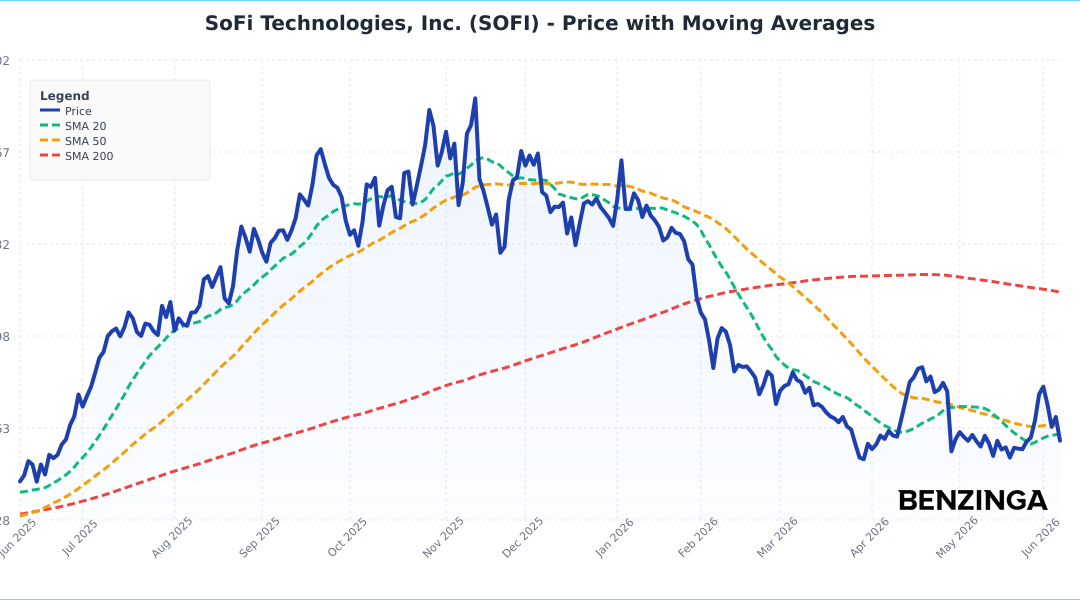
Critical Price Levels For SOFI To Watch
SoFi is trading just 0.1% below its 20-day SMA ($16.31) and 2.7% below its 50-day SMA ($16.75), which keeps it in a “stuck in the middle” zone where bounces can stall if buyers don’t quickly reclaim the 50-day. Zooming out, it’s still trading 12.8% below the 100-day SMA ($18.69) and 29.3% below the 200-day SMA ($23.06), so the longer-term trend still looks like repair rather than a clean uptrend.

RSI is 45.63, a neutral reading that suggests momentum isn’t stretched and the stock is still searching for direction after the May swing low and April swing high. In plain English, RSI helps gauge whether buying or selling pressure is getting “overdone,” and this level points more to consolidation than a breakout.

The moving-average structure still carries bearish baggage: the 20-day SMA is below the 50-day SMA, and the death cross (50-day below 200-day) that occurred in March remains a longer-term headwind. That setup often means rallies need follow-through quickly, or they risk rolling back into the broader downtrend.
- Key Support: $15.00 — a nearby round-number level that sits not far below current price and lines up as a practical “line in the sand” if the recent rebound starts to fail.
What Is SoFi Technologies And Its Business Model?
SoFi is a financial-services company that was founded in 2011 and is based in San Francisco. Initially known for its student loan refinancing business, the company has expanded its product offerings to include personal loans, credit cards, mortgages, investment accounts, banking services, and financial planning.
The company intends to be a one-stop shop for its clients’ finances and operates solely through its mobile app and website. Through its acquisition of Galileo in 2020, the company also offers payment and account services for debit cards and digital banking, so product rollouts like SoFiUSD matter because they can drive engagement and cross-sell over time.
SoFi Technologies Benzinga Edge Rankings Explained
Below is the Benzinga Edge scorecard for SoFi Technologies, highlighting its strengths and weaknesses compared to the broader market:
- Momentum: Weak (Score: 12.1) — The stock’s recent trend strength is lagging, which fits with price still sitting well below longer-term moving averages.
- Growth: Strong (Score: 98.21) — The scorecard is flagging a growth-forward profile, which is why product-driven narratives can have an outsized impact on sentiment.
The Verdict: SoFi Technologies’ Benzinga Edge signal reveals a growth-heavy profile with weak momentum. For longer-term bulls, that often means the story hinges on execution and follow-through, while technicians may want to see momentum improve and key moving averages reclaimed before getting more aggressive.
SOFI Stock Price Movement In Premarket Trading
SOFI Stock Price Activity: At the time of publication, SoFi Technologies shares were up 0.25% at $16.07 on Monday, according to Benzinga Pro data.
Image: Shutterstock
Recent Comments