Dogecoin (CRYPTO: DOGE) and Shiba Inu (CRYPTO: SHIB) each shed roughly 8% on Friday as Bitcoin (CRYPTO: BTC) drifted toward $60,000, with the heaviest selling concentrated in the most speculative corners of the crypto market.
Both Tokens Broke Key Support On Heavy Volume With Sellers In Control
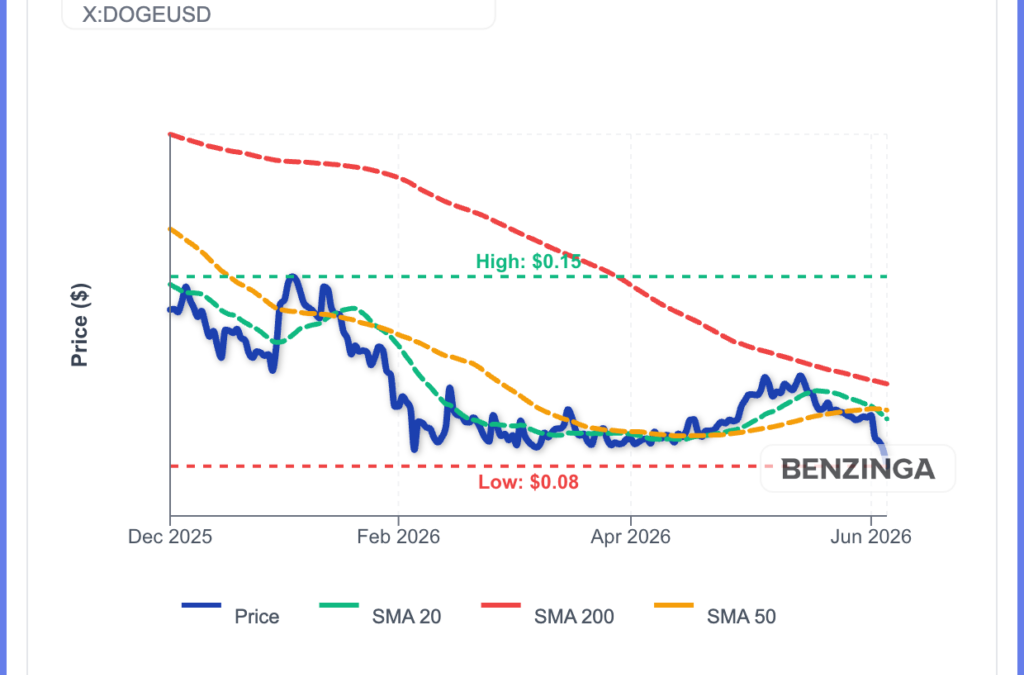
Dogecoin fell from $0.0891 to $0.0830, breaking the ascending channel that held since February and landing directly on the $0.080 horizontal support, the last structural level visible on the chart.
Shiba Inu dropped from $0.000004997 to $0.000004630, slicing through support near $0.000004780 on heavy selling pressure.
Both tokens saw their biggest volume spikes during the breakdown rather than on any recovery attempt, confirming sellers remained in control throughout the session.
Derivatives traders moved into defensive positioning, with DOGE futures open interest falling and SHIB open interest hovering near cycle lows.
Despite the selloff, both tokens showed sizeable exchange outflows beneath the surface, a pattern that typically signals accumulation rather than continued distribution.
DOGE RSI At 20 Matches Every Prior Bounce Signal Since September

Dogecoin’s RSI sits at 20.34, the most oversold reading since the September 2025 bottom and matching every prior bull divergence signal that preceded sharp recoveries on this chart.
The full EMA stack sits overhead as resistance between $0.0981 and $0.1194, with every moving average now acting as a ceiling.
Holding $0.080 and RSI reclaiming 30 sets up a bounce targeting the 20 EMA at $0.0981 then $0.1007.
A daily close below $0.080 removes the structural floor with the next visible level at $0.070.
SHIB Confirmed Descending Triangle Breakdown With No Floor Below

Shiba Inu confirmed a descending triangle breakdown that compressed price throughout the entire March to May period.
The rising lower trendline has been decisively breached with the full bearish EMA stack stacked overhead between $0.00000544 and $0.00000711. No visible structural support exists below current price.
The only psychological reference point sits at $0.00000400, with $0.00000300 as the next visible floor below that.
A bullish recovery requires reclaiming back inside the triangle above the 20 EMA at $0.00000544 with volume, targeting $0.00000610. Until that happens, the broken triangle pattern and broad market selling leave SHIB in complete price discovery to the downside.
Image: Shutterstock
Recent Comments