
Futures market trader Peter L. Brandt commended technical analyst Aksel Kibar on Sunday, praising his bullish call on the iShares MSCI Emerging Markets ETF (NYSE:EEM), which has clearly outperformed the broad U.S. market Index.
In a post on X, Brandt said, “Nice call Aksel. Headed much higher,” highlighting the chart setup for the EEM.
Kibar Highlights Technical Strength In EEM
The chart, shared by Kibar, signaled continued upside momentum for EEM, which is widely followed as a benchmark for emerging market stock performance.
In February, EEM achieved its longest winning streak since 2005, with nine consecutive weeks of gains. This performance marks a potential structural shift in investor sentiment, driven by a rotation out of U.S. tech stocks and into emerging markets.
Brandt’s post amplified attention around the trade setup among market participants and technical traders.
Inside EEM
EEM offers exposure to the large- and mid-cap companies across emerging market economies. Taiwan, China and South Korea firms make up the top holdings in the portfolio with 25.3%, 22.2% and 20.5% share, respectively.
In terms of the largest holdings in securities, Taiwan Semiconductor Manufacturing Co. Ltd (NYSE:TSM) takes the top spot with double-digit exposure. Samsung Electronics (OTC:SSNLF), SK Hynix, Tencent Holdings (OTC:TCEHY), and Alibaba Group (NYSE:BABA) round off the next four in the EEM portfolio.
Samsung and SK Hynix saw a sharp rally in their share prices this year, driven by continued demand for artificial intelligence-exposed chip names.
This emerging market ETF has assets under management (AUM) of $29.8 billion and trades in an average daily volume of 27 million shares. It has an expense ratio of 0.72%, much higher than its counterparts iShares Core MSCI Emerging Markets ETF (NYSE:IEMG) and Vanguard FTSE Emerging Markets ETF (NYSE:VWO), with expense ratios of 0.09% and 0.06%, respectively.
EEM hit a new record high of $67.96 on Friday. It has delivered cumulative annual returns of 105.1% over the past 10 years, 31.9% over the past one year and 2.8% since the start of the year.
When compared to its peers, the iShares ETF is leading in terms of price performance over the past year and YTD:
| ETFs | 1-year Returns | YTD Returns |
| EEM | 48.1% | 20.8% |
| IEMG | 48.08% | 20.3% |
| VWO | 28.0% | 10.2% |
The S&P 500 Index has gained 26.6% over the past year and 8% so far this year, suggesting that EEM is clearly leading the U.S. market index.
Emerging Markets Gain Investor Attention
The momentum in ETFs came amid the broader emerging market rally driven by a softer U.S. dollar and improving global risk sentiment.
The recent trends in currency markets reflect shifting investor strategies, particularly as institutional investors have increased their dollar hedge ratios to the highest level in two years. The ICE U.S. Dollar Index is down more than 2% over the past year.
Meanwhile, the ongoing U.S.-Iran conflict has resulted in a shift in investors’ sentiment towards regions linked to commodities. Over $1.1 billion has flowed into U.S.-listed EM ETFs in early April.
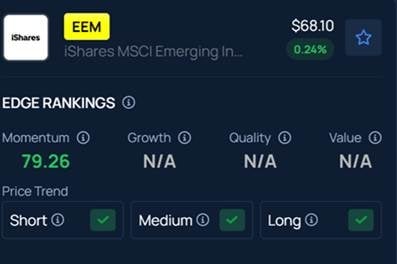
Benzinga Edge Stock Rankings indicate that EEM has a Momentum score in the 79th percentile. It maintains a strong price trend in the short, medium and long term.
Disclaimer: This content was partially produced with the help of AI tools and was reviewed and published by a Benzinga editor.
Photo Courtesy: FAMILY STOCK on Shutterstock.com
Recent Comments