When Michael Burry disclosed his short on the iShares Semiconductor ETF (NASDAQ:SOXX) on April 24, semiconductors were trading 43% above its 200-day moving average.
The reading was already the most extended in years and came after 18 straight positive sessions. The ‘Big Short’ investor told chip longs to sell. That call was early.
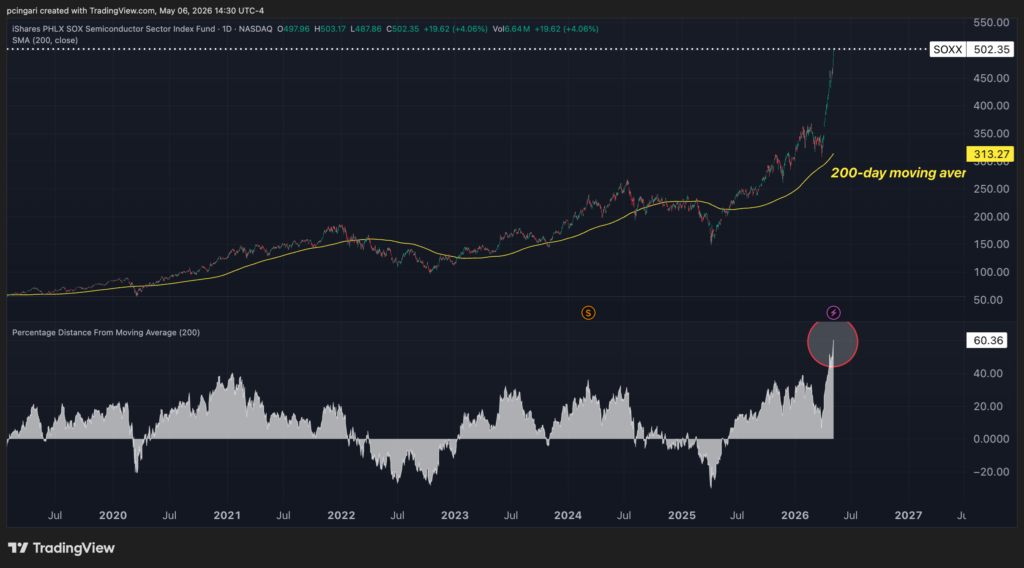
The gap between the chip sector and its long-term moving average has now widened to 60% in just 8 sessions since Burry’s call.
Chart: SOXX Trade 60% Off Its Key Long-Term Trend
SOXX rallied above $500 per share on Wednesday, the highest level in its history, after another 3.93% advance.
The fund’s 200-day moving average sits at $313.27. The distance between the two, currently 60%, is the largest since the ETF inception in July 2001 — a span that includes the dot-com unwind, the 2018 trade-war drawdown, the 2020 pandemic shock and the 2022 chip recession.
And SOXX is the conservative reading. Nine of its constituents trade further above their own 200-day lines than the index does.

The Stretch Beneath The Surface
The 200-day moving average is a slow-moving line that tracks where a stock has typically traded over the past ten months. Think of it as the long-term anchor for a price.
When a stock floats far above that anchor, it has either re-rated to a permanently higher plateau or it has run too far ahead of itself.
Mean reversion — the gravitational pullback toward that line — is one of the most reliable patterns in technical analysis.
The chip rally has stretched that anchor to its breaking point.
Which Chip Stocks Are More Stretched Than SOXX?
| Company | % Above 200-Day MA |
|---|---|
| Intel Corp. (NASDAQ:INTC) | +173.31% |
| Micron Technology Inc. (NASDAQ:MU) | +132.15% |
| Advanced Micro Devices Inc. (NASDAQ:AMD) | +94.04% |
| Marvell Technology Inc. (NASDAQ:MRVL) | +90.00% |
| Teradyne Inc. (NASDAQ:TER) | +79.33% |
| ON Semiconductor Corp. (NASDAQ:ON) | +79.31% |
| MACOM Technology Solutions Holdings Inc. (NASDAQ:MTSI) | +67.94% |
| Lam Research Corp. (NASDAQ:LRCX) | +67.20% |
| Arm Holdings plc (NASDAQ:ARM) | +65.28% |
What Burry Actually Bought
Burry disclosed via Substack on April 24, after the close, that he had purchased what he called a decent number of January 2027 SOXX puts struck at $330.
The fund traded around $455 that day, implying a roughly 27% drawdown for the trade to break even. With SOXX now at $502, that breakeven has widened to closer to 35%.
The trade was paired with new longs in software and services names — Microsoft Corp. (NASDAQ:MSFT), Adobe Inc. (NASDAQ:ADBE), PayPal Holdings Inc. (NASDAQ:PYPL) and MSCI Inc. (NYSE:MSCI) Burry framed it as a hardware-to-software rotation rather than a market short.
“I know the SOX will return to earth. Older semiconductor guys know it too. What is happening now is technical,” Burry said in his post.
Burry pointed to the fund’s then-43% gap from its 200-day line and an 18-session winning streak — at the time the longest in SOXX history — as evidence the move was technical rather than fundamental. The 14-day relative strength index closed near 85 the same week, the highest reading since January 2011.
What This Means For Investors
SOXX has never been more stretched relative to its long-term trend and nine of its components are stretched even further.
A 60% gap from the 200-day line has historically resolved through one of two paths: a sideways grind that lets the moving average catch up, or a sharp drawdown that closes the gap from the top.
The October 2025-to-March 2026 stretch exemplified the first path.
The 2000 unwind was an example of the second.
Burry’s January 2027 puts give him 9 months for either path to play out. The strike at $330 implies he expects the second.
Image via Midjourney.
Recent Comments