In today’s rapidly changing and highly competitive business world, it is imperative for investors and industry observers to carefully assess companies before making investment choices. In this article, we will undertake a comprehensive industry comparison, evaluating Micron Technology (NASDAQ:MU) vis-à-vis its key competitors in the Semiconductors & Semiconductor Equipment industry. Through a detailed analysis of important financial indicators, market standing, and growth potential, our goal is to provide valuable insights and highlight company’s performance in the industry.
Micron Technology Background
Micron is one of the largest semiconductor companies in the world, specializing in memory and storage chips. Its primary revenue stream comes from dynamic random access memory, or DRAM, and it also has minority exposure to not-and or NAND, flash chips. Micron serves a global customer base, selling chips into data centers, mobile phones, consumer electronics, and industrial and automotive applications. The firm is vertically integrated.
| Company | P/E | P/B | P/S | ROE | EBITDA (in billions) | Gross Profit (in billions) | Revenue Growth |
|---|---|---|---|---|---|---|---|
| Micron Technology Inc | 16.77 | 5.53 | 6.93 | 21.0% | $18.48 | $17.75 | 196.29% |
| NVIDIA Corp | 34.95 | 26.45 | 19.44 | 31.11% | $51.28 | $51.09 | 73.21% |
| Broadcom Inc | 60.31 | 18.34 | 22.05 | 9.12% | $11.15 | $13.16 | 29.47% |
| Advanced Micro Devices Inc | 78.07 | 5.27 | 9.62 | 2.44% | $2.86 | $5.58 | 34.11% |
| Texas Instruments Inc | 35.49 | 10.82 | 9.99 | 7.03% | $2.07 | $2.47 | 10.38% |
| Analog Devices Inc | 57.30 | 4.53 | 13.19 | 2.46% | $1.52 | $2.04 | 30.42% |
| Qualcomm Inc | 26.32 | 6.04 | 3.18 | 13.57% | $4.11 | $6.68 | 5.0% |
| Marvell Technology Inc | 31.82 | 5.97 | 10.37 | 2.79% | $0.75 | $1.15 | 22.08% |
| Monolithic Power Systems Inc | 82.29 | 14.72 | 18.32 | 4.95% | $0.21 | $0.41 | 20.83% |
| NXP Semiconductors NV | 24.77 | 4.95 | 4.08 | 4.53% | $0.98 | $1.81 | 7.2% |
| GLOBALFOUNDRIES Inc | 28.03 | 2.05 | 3.66 | 1.68% | $0.73 | $0.51 | 0.0% |
| ON Semiconductor Corp | 209.90 | 3.13 | 4.18 | 2.33% | $0.45 | $0.55 | -11.17% |
| First Solar Inc | 13.08 | 2.09 | 3.83 | 5.62% | $0.7 | $0.67 | 11.15% |
| Tower Semiconductor Ltd | 89.96 | 6.72 | 12.66 | 2.78% | $0.13 | $0.09 | 11.26% |
| Astera Labs Inc | 93.12 | 14.18 | 23.93 | 3.41% | $0.07 | $0.2 | 91.77% |
| MACOM Technology Solutions Holdings Inc | 103.39 | 12.67 | 16.78 | 3.64% | $0.07 | $0.15 | 24.52% |
| Credo Technology Group Holding Ltd | 52.99 | 9.62 | 16.77 | 10.03% | $0.16 | $0.28 | 201.49% |
| Lattice Semiconductor Corp | 4746 | 18.19 | 25.08 | -1.08% | $0.01 | $0.1 | 24.16% |
| Rambus Inc | 43.35 | 7.25 | 14.12 | 4.81% | $0.09 | $0.15 | 18.09% |
| Average | 322.84 | 9.61 | 12.85 | 6.18% | $4.3 | $4.84 | 33.55% |
By thoroughly analyzing Micron Technology, we can discern the following trends:
-
At 16.77, the stock’s Price to Earnings ratio is 0.05x less than the industry average, suggesting favorable growth potential.
-
The current Price to Book ratio of 5.53, which is 0.58x the industry average, is substantially lower than the industry average, indicating potential undervaluation.
-
With a relatively low Price to Sales ratio of 6.93, which is 0.54x the industry average, the stock might be considered undervalued based on sales performance.
-
With a Return on Equity (ROE) of 21.0% that is 14.82% above the industry average, it appears that the company exhibits efficient use of equity to generate profits.
-
The company exhibits higher Earnings Before Interest, Taxes, Depreciation, and Amortization (EBITDA) of $18.48 Billion, which is 4.3x above the industry average, implying stronger profitability and robust cash flow generation.
-
Compared to its industry, the company has higher gross profit of $17.75 Billion, which indicates 3.67x above the industry average, indicating stronger profitability and higher earnings from its core operations.
-
The company’s revenue growth of 196.29% exceeds the industry average of 33.55%, indicating strong sales performance and market outperformance.
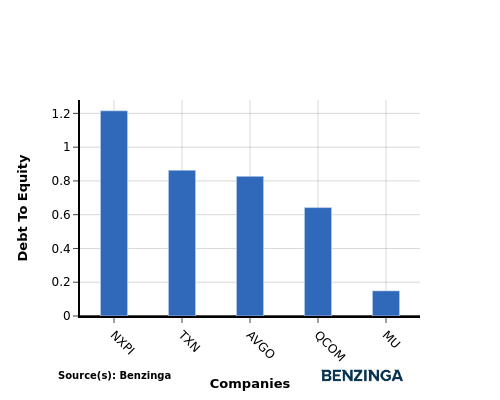
Debt To Equity Ratio

The debt-to-equity (D/E) ratio helps evaluate the capital structure and financial leverage of a company.
Considering the debt-to-equity ratio in industry comparisons allows for a concise evaluation of a company’s financial health and risk profile, aiding in informed decision-making.
When examining Micron Technology in comparison to its top 4 peers with respect to the Debt-to-Equity ratio, the following information becomes apparent:
-
Micron Technology has a stronger financial position compared to its top 4 peers, as evidenced by its lower debt-to-equity ratio of 0.15.
-
This suggests that the company has a more favorable balance between debt and equity, which can be perceived as a positive indicator by investors.
Key Takeaways
For Micron Technology, the PE, PB, and PS ratios are all low compared to industry peers, indicating potential undervaluation. On the other hand, the high ROE, EBITDA, gross profit, and revenue growth suggest strong financial performance and growth prospects relative to competitors in the Semiconductors & Semiconductor Equipment industry.
This article was generated by Benzinga’s automated content engine and reviewed by an editor.
Recent Comments