In today’s fast-paced and competitive business landscape, it is essential for investors and industry enthusiasts to thoroughly analyze companies before making investment decisions. In this article, we will conduct a comprehensive industry comparison, evaluating Meta Platforms (NASDAQ:META) against its key competitors in the Interactive Media & Services industry. By examining key financial metrics, market position, and growth prospects, we aim to provide valuable insights for investors and shed light on company’s performance within the industry.
Meta Platforms Background
Meta is the largest social media company in the world, boasting close to 4 billion monthly active users worldwide. The firm’s “Family of Apps,” its core business, consists of Facebook, Instagram, Messenger, and WhatsApp. End users can leverage these applications for a variety of different purposes, from keeping in touch with friends to following celebrities and running digital businesses for free. Meta packages customer data, gleaned from its application ecosystem and sells ads to digital advertisers. While the firm has been investing heavily in its Reality Labs business, it remains a very small part of Meta’s overall sales.
| Company | P/E | P/B | P/S | ROE | EBITDA (in billions) | Gross Profit (in billions) | Revenue Growth |
|---|---|---|---|---|---|---|---|
| Meta Platforms Inc | 25.72 | 7.03 | 7.74 | 11.07% | $31.22 | $48.99 | 23.78% |
| Reddit Inc | 53.80 | 9.19 | 12.93 | 9.08% | $0.24 | $0.67 | 69.65% |
| Pinterest Inc | 31.02 | 2.56 | 3.08 | 5.79% | $0.31 | $1.09 | 14.32% |
| FuboTV Inc | 3.44 | 1.41 | 0.26 | -1.76% | $0.01 | $0.11 | 249.37% |
| CarGurus Inc | 17.53 | 8.74 | 3.80 | 13.29% | $0.1 | $0.22 | 58.17% |
| Grindr Inc | 29.40 | 49.79 | 5.61 | 34.35% | $0.03 | $0.09 | 29.04% |
| ZoomInfo Technologies Inc | 16.25 | 1.25 | 1.60 | 2.28% | $0.07 | $0.27 | 3.24% |
| Ziff Davis Inc | 37.69 | 0.93 | 1.23 | 0.02% | $0.08 | $0.35 | -1.48% |
| Yelp Inc | 11.08 | 2.08 | 1.10 | 5.23% | $0.06 | $0.32 | -0.54% |
| Tripadvisor Inc | 32.44 | 1.79 | 0.70 | -5.62% | $-0.0 | $0.38 | 0.0% |
| Average | 25.85 | 8.64 | 3.37 | 6.96% | $0.1 | $0.39 | 46.86% |
Through a detailed examination of Meta Platforms, we can deduce the following trends:
-
At 25.72, the stock’s Price to Earnings ratio is 0.99x less than the industry average, suggesting favorable growth potential.
-
Considering a Price to Book ratio of 7.03, which is well below the industry average by 0.81x, the stock may be undervalued based on its book value compared to its peers.
-
The Price to Sales ratio of 7.74, which is 2.3x the industry average, suggests the stock could potentially be overvalued in relation to its sales performance compared to its peers.
-
The company has a higher Return on Equity (ROE) of 11.07%, which is 4.11% above the industry average. This suggests efficient use of equity to generate profits and demonstrates profitability and growth potential.
-
Compared to its industry, the company has higher Earnings Before Interest, Taxes, Depreciation, and Amortization (EBITDA) of $31.22 Billion, which is 312.2x above the industry average, indicating stronger profitability and robust cash flow generation.
-
Compared to its industry, the company has higher gross profit of $48.99 Billion, which indicates 125.62x above the industry average, indicating stronger profitability and higher earnings from its core operations.
-
With a revenue growth of 23.78%, which is much lower than the industry average of 46.86%, the company is experiencing a notable slowdown in sales expansion.
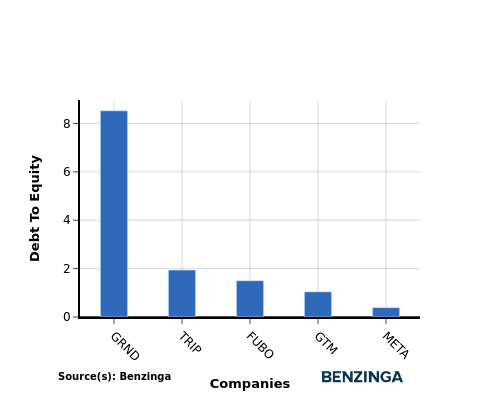
Debt To Equity Ratio

The debt-to-equity (D/E) ratio gauges the extent to which a company has financed its operations through debt relative to equity.
Considering the debt-to-equity ratio in industry comparisons allows for a concise evaluation of a company’s financial health and risk profile, aiding in informed decision-making.
When assessing Meta Platforms against its top 4 peers using the Debt-to-Equity ratio, the following comparisons can be made:
-
Meta Platforms demonstrates a stronger financial position compared to its top 4 peers in the sector.
-
With a lower debt-to-equity ratio of 0.39, the company relies less on debt financing and maintains a healthier balance between debt and equity, which can be viewed positively by investors.
Key Takeaways
For Meta Platforms, the PE and PB ratios suggest the stock is undervalued compared to peers, indicating potential for growth. However, the high PS ratio implies the stock may be overvalued based on revenue. In terms of ROE, EBITDA, and gross profit, Meta Platforms outperforms peers, indicating strong financial health. The low revenue growth rate may be a concern for future performance compared to industry peers.
This article was generated by Benzinga’s automated content engine and reviewed by an editor.
Recent Comments