In today’s fast-paced and competitive business landscape, it is essential for investors and industry enthusiasts to thoroughly analyze companies before making investment decisions. In this article, we will conduct a comprehensive industry comparison, evaluating Analog Devices (NASDAQ:ADI) against its key competitors in the Semiconductors & Semiconductor Equipment industry. By examining key financial metrics, market position, and growth prospects, we aim to provide valuable insights for investors and shed light on company’s performance within the industry.
Analog Devices Background
Analog Devices is a leading analog, mixed-signal, and digital-signal processing chipmaker. The firm has a significant market share lead in converter chips, which are used to translate analog signals to digital and vice versa. The company serves tens of thousands of customers; more than half of its chip sales are to industrial and automotive end markets. ADI’s chips are also incorporated into wireless infrastructure equipment.
| Company | P/E | P/B | P/S | ROE | EBITDA (in billions) | Gross Profit (in billions) | Revenue Growth |
|---|---|---|---|---|---|---|---|
| Analog Devices Inc | 56.57 | 4.47 | 13.03 | 2.46% | $1.52 | $2.04 | 30.42% |
| NVIDIA Corp | 35.24 | 26.68 | 19.61 | 31.11% | $51.28 | $51.09 | 73.21% |
| Broadcom Inc | 60.53 | 18.41 | 22.13 | 9.12% | $11.15 | $13.16 | 29.47% |
| Micron Technology Inc | 19.96 | 6.58 | 8.25 | 21.0% | $18.48 | $17.75 | 196.29% |
| Advanced Micro Devices Inc | 77.14 | 5.21 | 9.51 | 2.44% | $2.86 | $5.58 | 34.11% |
| Texas Instruments Inc | 34.35 | 10.47 | 9.67 | 7.03% | $2.07 | $2.47 | 10.38% |
| Qualcomm Inc | 26.19 | 6.01 | 3.17 | 13.57% | $4.11 | $6.68 | 5.0% |
| Marvell Technology Inc | 28.64 | 5.37 | 9.33 | 2.79% | $0.75 | $1.15 | 22.08% |
| Monolithic Power Systems Inc | 83.11 | 14.87 | 18.50 | 4.95% | $0.21 | $0.41 | 20.83% |
| NXP Semiconductors NV | 24.07 | 4.81 | 3.97 | 4.53% | $0.98 | $1.81 | 7.2% |
| GLOBALFOUNDRIES Inc | 27.09 | 1.98 | 3.54 | 1.68% | $0.73 | $0.51 | 0.0% |
| ON Semiconductor Corp | 204.34 | 3.04 | 4.07 | 2.33% | $0.45 | $0.55 | -11.17% |
| First Solar Inc | 13.57 | 2.17 | 3.97 | 5.62% | $0.7 | $0.67 | 11.15% |
| Astera Labs Inc | 95.11 | 14.48 | 24.44 | 3.41% | $0.07 | $0.2 | 91.77% |
| Tower Semiconductor Ltd | 84.45 | 6.31 | 11.88 | 2.78% | $0.13 | $0.09 | 11.26% |
| Credo Technology Group Holding Ltd | 56.81 | 10.32 | 17.98 | 10.03% | $0.16 | $0.28 | 201.49% |
| MACOM Technology Solutions Holdings Inc | 99.08 | 12.14 | 16.08 | 3.64% | $0.07 | $0.15 | 24.52% |
| Lattice Semiconductor Corp | 4430.50 | 16.97 | 23.41 | -1.08% | $0.01 | $0.1 | 24.16% |
| Rambus Inc | 43.47 | 7.27 | 14.16 | 4.81% | $0.09 | $0.15 | 18.09% |
| Average | 302.43 | 9.62 | 12.43 | 7.21% | $5.24 | $5.71 | 42.77% |
By analyzing Analog Devices, we can infer the following trends:
-
The Price to Earnings ratio of 56.57 is 0.19x lower than the industry average, indicating potential undervaluation for the stock.
-
With a Price to Book ratio of 4.47, significantly falling below the industry average by 0.46x, it suggests undervaluation and the possibility of untapped growth prospects.
-
The Price to Sales ratio of 13.03, which is 1.05x the industry average, suggests the stock could potentially be overvalued in relation to its sales performance compared to its peers.
-
With a Return on Equity (ROE) of 2.46% that is 4.75% below the industry average, it appears that the company exhibits potential inefficiency in utilizing equity to generate profits.
-
With lower Earnings Before Interest, Taxes, Depreciation, and Amortization (EBITDA) of $1.52 Billion, which is 0.29x below the industry average, the company may face lower profitability or financial challenges.
-
With lower gross profit of $2.04 Billion, which indicates 0.36x below the industry average, the company may experience lower revenue after accounting for production costs.
-
The company’s revenue growth of 30.42% is significantly lower compared to the industry average of 42.77%. This indicates a potential fall in the company’s sales performance.
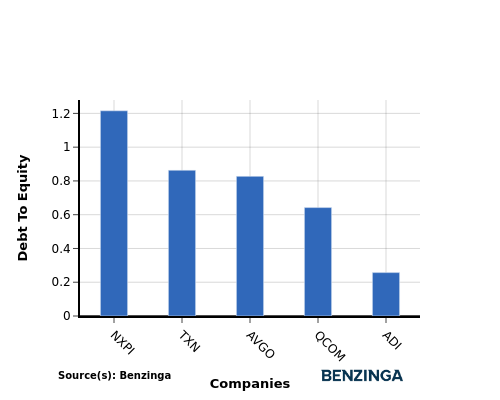
Debt To Equity Ratio

The debt-to-equity (D/E) ratio helps evaluate the capital structure and financial leverage of a company.
Considering the debt-to-equity ratio in industry comparisons allows for a concise evaluation of a company’s financial health and risk profile, aiding in informed decision-making.
By analyzing Analog Devices in relation to its top 4 peers based on the Debt-to-Equity ratio, the following insights can be derived:
-
Compared to its top 4 peers, Analog Devices has a stronger financial position indicated by its lower debt-to-equity ratio of 0.26.
-
This suggests that the company relies less on debt financing and has a more favorable balance between debt and equity, which can be seen as a positive attribute by investors.
Key Takeaways
For Analog Devices, the PE and PB ratios are low compared to peers, indicating potential undervaluation. However, the high PS ratio suggests overvaluation based on revenue. The low ROE, EBITDA, gross profit, and revenue growth further indicate underperformance compared to industry peers.
This article was generated by Benzinga’s automated content engine and reviewed by an editor.
Recent Comments