Bitcoin (CRYPTO: BTC) is down 23% through the first 50 days of 2026, marking its weakest start to a year on record as spot ETFs hemorrhaged nearly $4 billion in five weeks.
The Historic Decline
Bitcoin has never previously posted consecutive declines in January and February.
The asset fell 10% in January and another 15% in February, setting up the first-ever back-to-back monthly losses to start a year.
While double-digit January drops occurred in 2015, 2016, and 2018, each was followed by a positive February.
If losses hold, Bitcoin is also on track for its weakest consecutive monthly performance since 2022.
The weakness follows a 17% decline in 2025, a post-election year.
Historically, post-election years tend to outperform election years on aggregate, making the recent underperformance stand out further.
The ETF Bleeding
Spot Bitcoin ETFs saw $165.76 million in net outflows Thursday, the third consecutive day of redemptions.
The latest withdrawals bring the five-week total to just under $4 billion following weekly outflows of $403.9 million, $359.9 million, $318.1 million, $1.49 billion, and $1.33 billion since mid-January.
Glassnode data shows U.S. spot Bitcoin ETF balances declined by roughly 100,300 BTC since October, falling to approximately 1.26 million BTC—the largest drawdown of the current market cycle.
The sustained outflows test whether institutional appetite for Bitcoin exposure is cooling or simply resetting after a strong 2025.
Experts remain divided on whether the bleeding reflects structural weakness or controlled deleveraging.
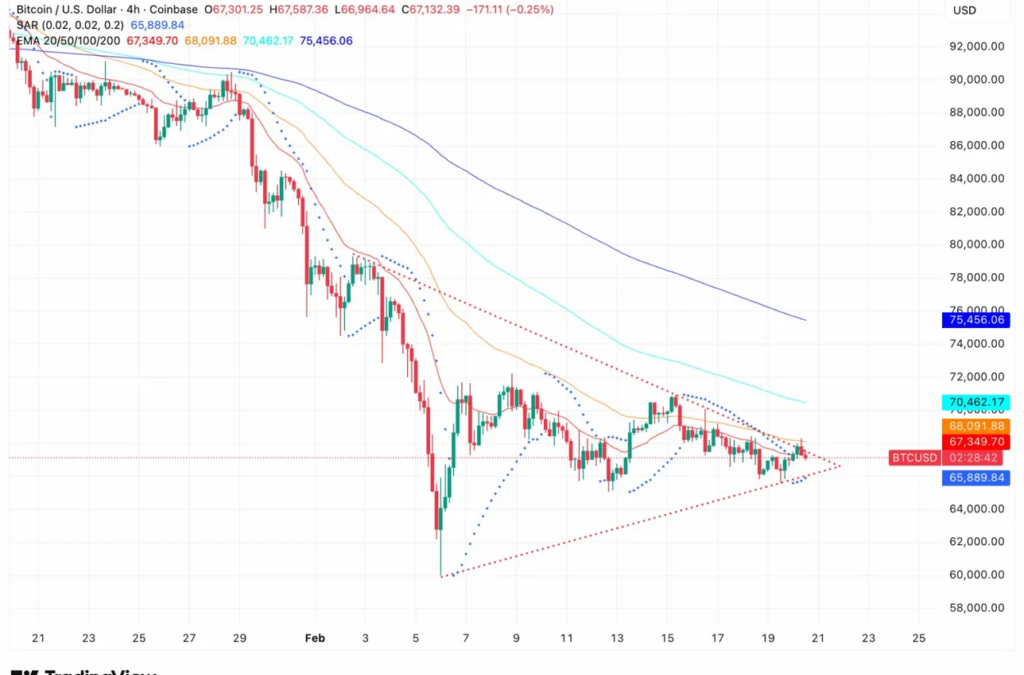
The Triangle Breakout Setup
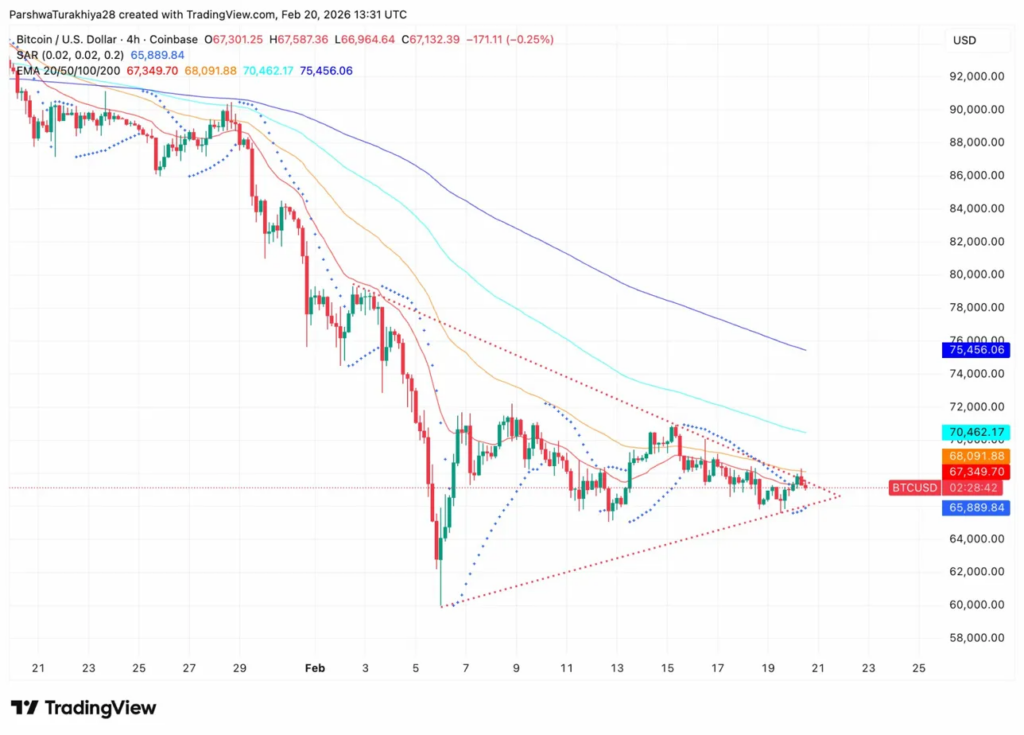
Bitcoin is compressed into a tightening symmetrical triangle between ascending support from the $61,000 capitulation low and descending resistance from $72,000 recent highs.
The pattern has narrowed to the $66,000-$68,000 range, indicating a decisive breakout is imminent.
The Parabolic SAR at $65,889 sits just below price, mildly constructive for near-term support.
However, all EMAs stack overhead as resistance: 20 EMA at $67,349, 50 EMA at $68,091, 100 EMA at $70,462, and 200 EMA at $75,456.
Symmetrical triangles are continuation patterns 60-70% of the time, typically breaking in the direction of the prior trend.
Given Bitcoin arrived from a severe downtrend, statistical bias favors a breakdown.
Critical support sits at $65,500-$66,000. Breaking below triggers selling toward $63,000, then retesting $61,000-$62,000.
Meanwhile, breaking above $68,500-$69,000 projects a measured move to $75,000-$77,000.
Image: Shutterstock
Recent Comments