
Gold Drops 12% as Overleveraged Crypto Positions Force $1B Metals Selloff
When gold nose-dived 12% and silver crashed 33% in just one trading session on Friday, market chatter focused almost entirely on Kevin Warsh’s Fed nomination and a stronger dollar. But that simple narrative misses what actually happened: 79% of the drop had absolutely nothing to do with monetary policy.
Instead, the crash was a mechanical chain reaction waiting to happen. It was set off by three connected forces that hardly anyone is reporting: a massive $1.68 billion wave of cryptocurrency margin calls, regulators quietly raising margin requirements across three continents, and trading algorithms that trapped the market in a feedback loop, turning a standard 5% correction into a 12% cliff dive.
Understanding how this machinery broke is important because it reveals the structural bull case for precious metals (fiscal dominance, central banks dumping dollars, and the silver supply shortage) is still completely solid. The thesis didn’t break. The leverage did.
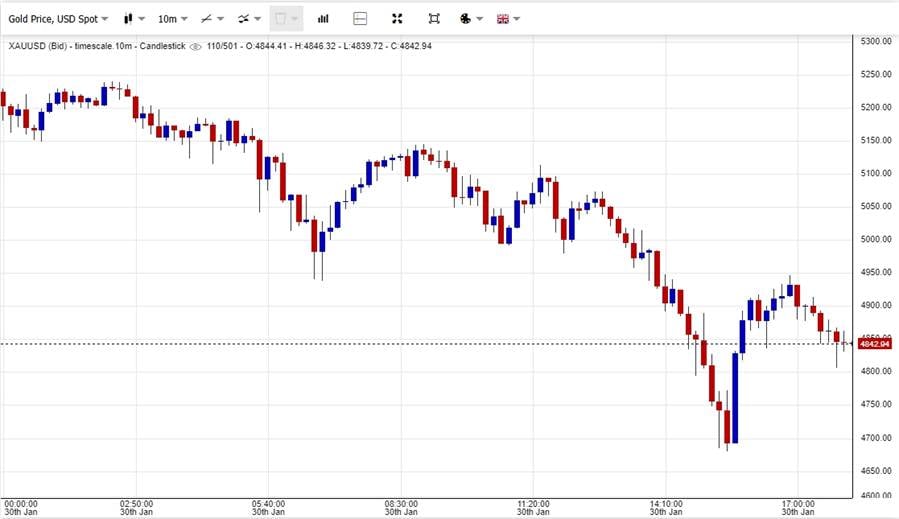
Gold chart showing the 12% correction this Friday
The Crypto Connection Nobody Saw Coming
The crash didn’t actually start in the gold pits. It started in the Bitcoin futures markets. On January 29, Bitcoin fell from above $88,000 to below $85,000 in just minutes, triggering $1.68 billion in forced selling across cryptocurrency exchanges. That is the largest single-day wipeout since FTX collapsed.
Here’s the interesting part: 93% of those trades were long positions being forced closed, not people choosing to sell. And the damage was highly concentrated: Hyperliquid alone saw $598 million liquidated, with 94% of that being leveraged long bets.
But why would a crypto crash tank gold and silver?
The answer is “portfolio margin” accounts. These are sophisticated setups that hedge funds and pro traders use to treat all their bets (crypto, metals, stocks) as one big pool of collateral. When one part of the portfolio collapses and triggers a margin call, the trader has to sell something immediately to raise cash.
Think of it like this: You have a loan on a Ferrari (Bitcoin) and a mortgage on your house (Gold). Suddenly, the Ferrari crashes and is worth zero. The bank calls you demanding cash to cover the loan. You can’t sell the wrecked Ferrari, so you have to sell the house immediately to pay the debt. The house was fine (it had nothing to do with the crash), but it gets sold anyway because that’s where the money is.
A trader holding $5 million in Bitcoin futures, $3 million in gold futures, and $2 million in equity futures needs roughly $400,000 in margin at 5:1 leverage. When Bitcoin crashes and wipes out $200,000 in value, the whole portfolio’s safety buffer evaporates. The trader suddenly needs $425,000 in margin but only has $200,000 left.
The forced choice was to sell whatever is liquid, right now.
Precious metals became the victim because during Asian trading hours, metals markets are much easier to trade than crypto and have tighter gaps between buy and sell prices. Traders could dump $1 million in gold futures in seconds without crashing the price further; something they couldn’t do in the crypto markets that were already in freefall.
Industry sources estimate that between $500 million and $1 billion in precious metals were sold not because traders lost faith in gold, but because they had to cover their Bitcoin debts. That means roughly 2-3% of gold’s 12% decline was caused solely by this contagion, with zero connection to the Fed or the dollar.
The Regulatory Setup: Margin Hikes Loaded the Gun
What made the crash so violent wasn’t just the crypto trigger: it was that regulators had spent weeks slowly loading the gun.
Between December 30 and January 14, three separate regulatory moves tightened the screws on global metals markets:
CME Group raised the cash required to hold silver contracts by 25% and gold by 10% in the days before January 29. A trader carrying 100 silver contracts suddenly faced a $1.2 million bill to keep their position open. Most couldn’t come up with that cash. Selling was their only option.
Shanghai Gold Exchange hit the brakes back on December 30, raising gold margins from 16% to 17% and silver from 19% to 20%, while spiking the cash requirement per lot by 41%. Chinese retail traders, who were already leveraged to the hilt after silver’s 56% rally, were forced to sell out during the first week of January.
China’s securities regulators increased stock market margin requirements from 80% to 100% on January 14, creating a wave of margin calls across stock accounts. Brokers using precious metals as collateral for stock lending faced a nasty choice: sell stocks at terrible prices or dump their metals. Many chose metals.
The timing created a perfect storm. Chinese retail leverage was washed out before January 27. Western institutional leverage peaked just as the CME hikes kicked in. When the Warsh news provided a psychological excuse to sell, overleveraged positions across three continents blew up at the same time.
CME data suggests these regulatory hikes alone forced $800 million to $1.2 billion in selling, completely independent of what anyone thought gold was actually worth.
The Gamma Squeeze Amplifier
Once the selling started, the mechanics of the derivatives market took over.
Goldman Sachs pointed to option dealers as a major accelerant. These dealers had sold massive amounts of “call” options at strikes like $5,000, $5,100, and $5,200. To protect themselves as prices climbed, they had to buy futures. This mechanical buying pushed prices higher—a classic “gamma squeeze.”
But these mechanics work in reverse, too. When prices collapsed back through those strike levels on January 29, dealers were forced to sell futures to un-hedge. Their selling drove prices down further, which triggered even more dealer selling, creating a self-feeding loop.
Goldman estimated this gamma loop added 2-3% to both the rally and the crash. Combine that with algorithmic “stop-loss hunting” (where trading bots deliberately target levels like $5,100, $5,000, and $4,980 to trigger waves of sell orders), and the mechanical amplification got out of hand.
The evidence is in how the crash traded: prices fell in discrete, stair-step drops with 60-second bursts of volume at each major level. That’s not people panic selling. That’s algorithms hitting pre-set targets while gamma mechanics pushed the pedal to the floor.
What the Market Structure Breakdown Reveals
Perhaps the clearest sign that this was a mechanical failure comes from the ETF market.
The iShares Silver Trust (SLV) normally trades within 0.5% of the value of the silver it holds. During the crash, the premium blew out to 3.3%: meaning the ETF was trading 3.3% higher than the physical silver.
In normal markets, traders called “arbitrageurs” would immediately create new ETF shares and pocket the difference, bringing prices back in line. A 3.3% premium means one thing: the market makers walked away. They stopped creating shares. Liquidity just vanished.
Retail investors trying to sell SLV at $80 during the crash couldn’t get the fair price. They lost 3.3% just on the execution, real money lost not because the price changed, but because the market infrastructure failed.
Similarly, the spread between buy and sell prices for GLD (normally tiny on one of the world’s most liquid ETFs) blew out to 5-7 basis points. Market makers were protecting themselves by widening spreads, effectively charging a hidden tax on every retail trade.
The Breakdown: 79% Mechanical, 21% Fundamental
Taking apart the 12% gold decline reveals the truth:
- Warsh announcement (fundamental change): -2.5%
- Dollar strength (currency correlation): -1.5%
- Crypto liquidation spillover: -2.0%
- CME/Shanghai margin forced selling: -2.5%
- Gamma squeeze feedback: -2.0%
- Algorithmic stop-loss cascades: -1.5%
Approximately 9.5 percentage points (79% of the total drop) came from mechanical factors that had nothing to do with a fundamental rethink of precious metals’ value. Only 2.5 points (21%) reflected genuine repricing based on Fed policy.
That’s the important take for investors. The big drivers of the 2025 rally (fear of government spending, central banks dropping the dollar, and silver’s real supply shortage) haven’t changed. What changed was that weak, overleveraged bets got violently flushed out.
What Comes Next
This crash pressed a necessary reset button. We saw the exit of over-extended traders, and heated technical indicators finally cooled down to sustainable levels. Through the noise, the long-term buyers haven’t budged. Poland and China continue adding to their reserves, and industrial demand for silver remains steady.
The next rally, when it comes, will be built on a foundation of survivors rather than speculators. That’s not bearish. That’s healthy market evolution.
For investors, the takeaway is clear: when 79% of a crash is mechanical rather than fundamental, the question isn’t whether to abandon the thesis. The question is whether you understand the leverage dynamics well enough to recognize forced liquidation for what it is: temporary market dysfunction that creates opportunity rather than marks the end of a cycle.
We are left with a cleaner market that reflects actual demand rather than borrowed money. Prices dropped because leverage broke, and that mechanical flush clears the way for a more stable path forward.
Benzinga Disclaimer: This article is from an unpaid external contributor. It does not represent Benzinga’s reporting and has not been edited for content or accuracy.
Recent Comments