In the dynamic and fiercely competitive business environment, conducting a thorough analysis of companies is crucial for investors and industry enthusiasts. In this article, we will perform an extensive industry comparison, evaluating Micron Technology (NASDAQ:MU) in relation to its major competitors in the Semiconductors & Semiconductor Equipment industry. By closely examining crucial financial metrics, market position, and growth prospects, we aim to offer valuable insights for investors and shed light on company’s performance within the industry.
Micron Technology Background
Micron is one of the largest semiconductor companies in the world, specializing in memory and storage chips. Its primary revenue stream comes from dynamic random access memory, or DRAM, and it also has minority exposure to not-and or NAND, flash chips. Micron serves a global customer base, selling chips into data centers, mobile phones, consumer electronics, and industrial and automotive applications. The firm is vertically integrated.
| Company | P/E | P/B | P/S | ROE | EBITDA (in billions) | Gross Profit (in billions) | Revenue Growth |
|---|---|---|---|---|---|---|---|
| Micron Technology Inc | 41.42 | 8.34 | 11.63 | 9.28% | $8.35 | $7.65 | 56.65% |
| NVIDIA Corp | 47.65 | 39.35 | 25.29 | 29.14% | $38.75 | $41.85 | 62.49% |
| Broadcom Inc | 69.34 | 19.29 | 25.12 | 11.02% | $9.86 | $12.25 | 28.18% |
| Advanced Micro Devices Inc | 132.03 | 6.75 | 12.85 | 2.06% | $2.11 | $4.78 | 35.59% |
| Texas Instruments Inc | 40.18 | 12.20 | 11.31 | 7.07% | $2.24 | $2.72 | -6.73% |
| Qualcomm Inc | 30.38 | 7.67 | 3.80 | -12.88% | $3.51 | $6.24 | 10.03% |
| Analog Devices Inc | 69.89 | 4.61 | 14.37 | 2.32% | $1.47 | $1.94 | 25.91% |
| Marvell Technology Inc | 28.64 | 4.91 | 9.07 | 13.84% | $2.58 | $1.07 | 36.83% |
| NXP Semiconductors NV | 28.86 | 5.85 | 4.94 | 6.43% | $1.11 | $1.79 | -2.37% |
| Monolithic Power Systems Inc | 30.35 | 15.89 | 21.41 | 5.12% | $0.21 | $0.41 | 18.88% |
| ON Semiconductor Corp | 85.21 | 3.17 | 4.20 | 3.22% | $0.44 | $0.59 | -11.98% |
| First Solar Inc | 17.19 | 2.67 | 4.77 | 5.19% | $0.61 | $0.61 | 79.67% |
| Credo Technology Group Holding Ltd | 111.61 | 18.18 | 31.06 | 7.99% | $0.09 | $0.18 | 272.08% |
| Tower Semiconductor Ltd | 77.68 | 5.31 | 10.06 | 1.9% | $0.13 | $0.09 | 6.79% |
| Rambus Inc | 57.91 | 10.16 | 19.50 | 3.84% | $0.08 | $0.14 | 22.68% |
| Lattice Semiconductor Corp | 416.55 | 16.13 | 23.26 | 0.4% | $0.01 | $0.09 | 4.92% |
| Average | 82.9 | 11.48 | 14.73 | 5.78% | $4.21 | $4.98 | 38.86% |
By thoroughly analyzing Micron Technology, we can discern the following trends:
-
The Price to Earnings ratio of 41.42 is 0.5x lower than the industry average, indicating potential undervaluation for the stock.
-
Considering a Price to Book ratio of 8.34, which is well below the industry average by 0.73x, the stock may be undervalued based on its book value compared to its peers.
-
Based on its sales performance, the stock could be deemed undervalued with a Price to Sales ratio of 11.63, which is 0.79x the industry average.
-
The Return on Equity (ROE) of 9.28% is 3.5% above the industry average, highlighting efficient use of equity to generate profits.
-
The company exhibits higher Earnings Before Interest, Taxes, Depreciation, and Amortization (EBITDA) of $8.35 Billion, which is 1.98x above the industry average, implying stronger profitability and robust cash flow generation.
-
Compared to its industry, the company has higher gross profit of $7.65 Billion, which indicates 1.54x above the industry average, indicating stronger profitability and higher earnings from its core operations.
-
The company’s revenue growth of 56.65% is notably higher compared to the industry average of 38.86%, showcasing exceptional sales performance and strong demand for its products or services.
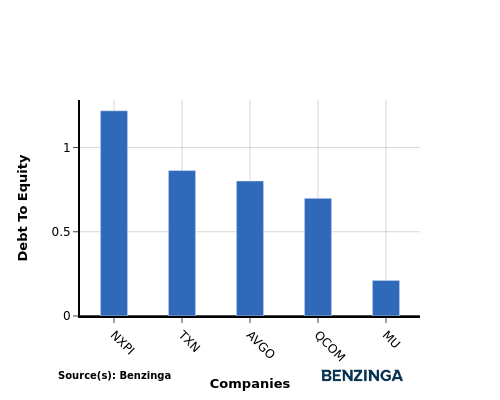
Debt To Equity Ratio

The debt-to-equity (D/E) ratio gauges the extent to which a company has financed its operations through debt relative to equity.
Considering the debt-to-equity ratio in industry comparisons allows for a concise evaluation of a company’s financial health and risk profile, aiding in informed decision-making.
When evaluating Micron Technology alongside its top 4 peers in terms of the Debt-to-Equity ratio, the following insights arise:
-
Among its top 4 peers, Micron Technology has a stronger financial position with a lower debt-to-equity ratio of 0.21.
-
This indicates that the company relies less on debt financing and maintains a more favorable balance between debt and equity, which can be viewed positively by investors.
Key Takeaways
For Micron Technology, the PE, PB, and PS ratios are all low compared to industry peers, indicating potential undervaluation. On the other hand, the high ROE, EBITDA, gross profit, and revenue growth suggest strong financial performance and growth prospects relative to competitors in the Semiconductors & Semiconductor Equipment industry.
This article was generated by Benzinga’s automated content engine and reviewed by an editor.
Recent Comments