Ethereum (CRYPTO: ETH) active addresses hit an all-time high of 718,000 on the 7-day moving average as ETH consolidates, creating a bullish divergence that historically signals price gains are coming.
Record Network Activity vs. Flat Price
Ethereum’s 7-day simple moving average of active addresses surged to 718,000—a new all-time high that shows massive user demand and network interaction.
The divergence is striking: network activity is exploding while price consolidates.
ETH is up 3% today, but hasn’t broken out of its range despite record participation.
Historically, this kind of divergence acts as a leading indicator for bullish price moves. Network growth tends to precede price appreciation as fundamental utility strengthens.
The surge suggests Layer-2 adoption, renewed DeFi activity, or fresh retail interest is driving usage. The network is vibrant—the market just hasn’t repriced ETH to reflect it yet.
Bloomberg’s Mike McGlone Sees Downside Risk
Bloomberg commodity strategist Mike McGlone posted: “Ether appears to be heading toward the lower end of its $2,000-$4,000 range since 2023.
I see greater risks of it staying below $2,000 than above $4,000, especially when stock market volatility rebounds,” he added.
That bearish view contrasts sharply with the on-chain data showing record network activity.
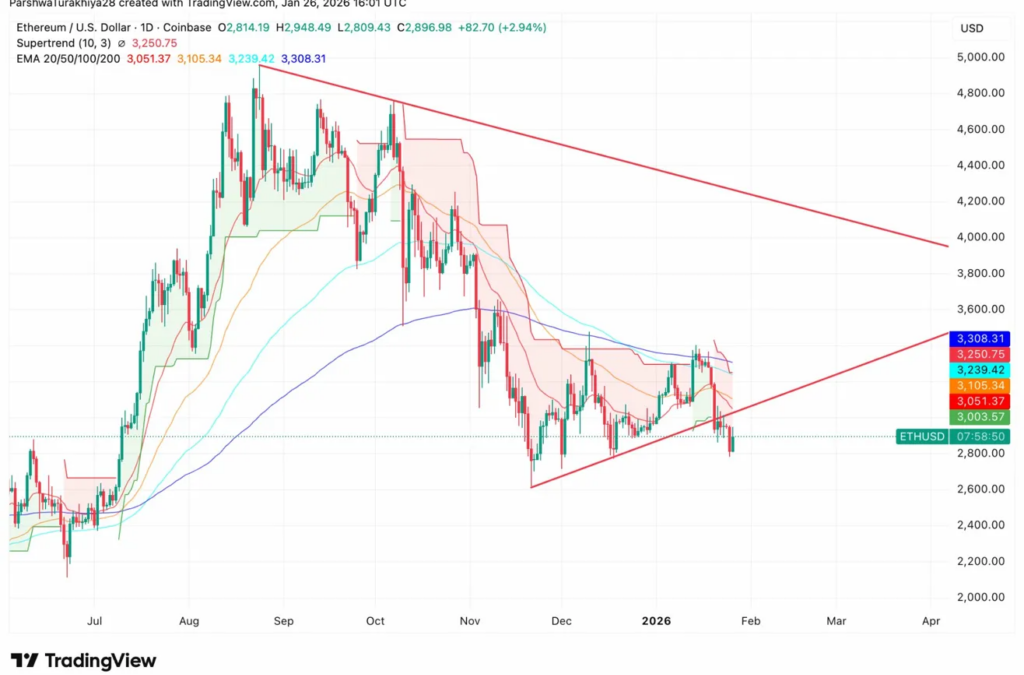
Technical Setup: Symmetrical Triangle At Apex

ETH is consolidating in a symmetrical triangle pattern since dropping from $4,600 in November 2025.
The converging trendlines from the highs and December/January lows suggest an imminent breakout within the next 2-4 weeks.
The 200 EMA at $3,308 aligns precisely with current price, acting as a critical inflection point.
Price trading above the 200 EMA after an extended period below typically signals medium-term bullish momentum.
The 20 EMA at $3,051 and 50 EMA at $3,105 have crossed bullish and provide dynamic support. The 100 EMA at $3,239 is immediate resistance.
The Supertrend indicator at $3,250 flipped bullish, confirming the short-term momentum shift.

Moreover, current netflow shows -$170.42 million, with persistent outflows since mid-2025 indicating exchange withdrawals.
Key Levels To Watch
- Resistance: $3,400-$3,450 is the psychological level and previous consolidation zone. Breaking $3,450 with volume targets $3,800. The $4,400-$4,600 zone represents 2025 highs and strong resistance.
- Support: $3,200-$3,240 is the 100 EMA and rising trendline confluence—the critical hold zone. $3,000-$3,050 clusters the 20/50 EMAs. $2,800-$2,850 is triangle support and the invalidation level.
Image: Shutterstock
Recent Comments