In today’s fast-paced and highly competitive business world, it is crucial for investors and industry followers to conduct comprehensive company evaluations. In this article, we will delve into an extensive industry comparison, evaluating Micron Technology (NASDAQ:MU) in relation to its major competitors in the Semiconductors & Semiconductor Equipment industry. By closely examining key financial metrics, market standing, and growth prospects, our objective is to provide valuable insights and highlight company’s performance in the industry.
Micron Technology Background
Micron is one of the largest semiconductor companies in the world, specializing in memory and storage chips. Its primary revenue stream comes from dynamic random access memory, or DRAM, and it also has minority exposure to not-and or NAND, flash chips. Micron serves a global customer base, selling chips into data centers, mobile phones, consumer electronics, and industrial and automotive applications. The firm is vertically integrated.
| Company | P/E | P/B | P/S | ROE | EBITDA (in billions) | Gross Profit (in billions) | Revenue Growth |
|---|---|---|---|---|---|---|---|
| Micron Technology Inc | 37.79 | 7.61 | 10.61 | 9.28% | $8.35 | $7.65 | 56.65% |
| NVIDIA Corp | 45.75 | 37.79 | 24.28 | 29.14% | $38.75 | $41.85 | 62.49% |
| Broadcom Inc | 68.24 | 18.98 | 24.72 | 11.02% | $9.86 | $12.25 | 28.18% |
| Advanced Micro Devices Inc | 132.84 | 6.80 | 12.93 | 2.06% | $2.11 | $4.78 | 35.59% |
| Texas Instruments Inc | 35.52 | 10.66 | 10.34 | 8.21% | $2.24 | $2.72 | 14.24% |
| Qualcomm Inc | 31.50 | 7.97 | 3.94 | -12.88% | $3.51 | $6.24 | 10.03% |
| Analog Devices Inc | 67.66 | 4.47 | 13.91 | 2.32% | $1.47 | $1.94 | 25.91% |
| Marvell Technology Inc | 29.26 | 5.01 | 9.26 | 13.84% | $2.58 | $1.07 | 36.83% |
| NXP Semiconductors NV | 29.26 | 5.93 | 5.01 | 6.43% | $1.11 | $1.79 | -2.37% |
| Monolithic Power Systems Inc | 27.62 | 14.46 | 19.48 | 5.12% | $0.21 | $0.41 | 18.88% |
| ON Semiconductor Corp | 86.40 | 3.21 | 4.26 | 3.22% | $0.44 | $0.59 | -11.98% |
| First Solar Inc | 18.39 | 2.85 | 5.10 | 5.19% | $0.61 | $0.61 | 79.67% |
| Credo Technology Group Holding Ltd | 116.47 | 18.98 | 32.41 | 7.99% | $0.09 | $0.18 | 272.08% |
| Tower Semiconductor Ltd | 75.14 | 5.14 | 9.73 | 1.9% | $0.13 | $0.09 | 6.79% |
| Rambus Inc | 59.41 | 10.42 | 20 | 3.84% | $0.08 | $0.14 | 22.68% |
| Lattice Semiconductor Corp | 426.55 | 16.52 | 23.82 | 0.4% | $0.01 | $0.09 | 4.92% |
| Average | 83.33 | 11.28 | 14.61 | 5.85% | $4.21 | $4.98 | 40.26% |
By carefully studying Micron Technology, we can deduce the following trends:
-
The Price to Earnings ratio of 37.79 is 0.45x lower than the industry average, indicating potential undervaluation for the stock.
-
With a Price to Book ratio of 7.61, significantly falling below the industry average by 0.67x, it suggests undervaluation and the possibility of untapped growth prospects.
-
The Price to Sales ratio is 10.61, which is 0.73x the industry average. This suggests a possible undervaluation based on sales performance.
-
With a Return on Equity (ROE) of 9.28% that is 3.43% above the industry average, it appears that the company exhibits efficient use of equity to generate profits.
-
Compared to its industry, the company has higher Earnings Before Interest, Taxes, Depreciation, and Amortization (EBITDA) of $8.35 Billion, which is 1.98x above the industry average, indicating stronger profitability and robust cash flow generation.
-
Compared to its industry, the company has higher gross profit of $7.65 Billion, which indicates 1.54x above the industry average, indicating stronger profitability and higher earnings from its core operations.
-
The company’s revenue growth of 56.65% exceeds the industry average of 40.26%, indicating strong sales performance and market outperformance.
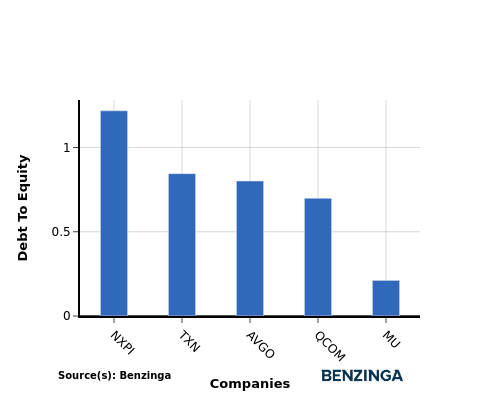
Debt To Equity Ratio

The debt-to-equity (D/E) ratio is a key indicator of a company’s financial health and its reliance on debt financing.
Considering the debt-to-equity ratio in industry comparisons allows for a concise evaluation of a company’s financial health and risk profile, aiding in informed decision-making.
When examining Micron Technology in comparison to its top 4 peers with respect to the Debt-to-Equity ratio, the following information becomes apparent:
-
When comparing the debt-to-equity ratio, Micron Technology is in a stronger financial position compared to its top 4 peers.
-
The company has a lower level of debt relative to its equity, indicating a more favorable balance between the two with a lower debt-to-equity ratio of 0.21.
Key Takeaways
For Micron Technology, the PE, PB, and PS ratios are all low compared to industry peers, indicating potential undervaluation. On the other hand, the high ROE, EBITDA, gross profit, and revenue growth suggest strong financial performance and growth prospects relative to competitors in the Semiconductors & Semiconductor Equipment industry.
This article was generated by Benzinga’s automated content engine and reviewed by an editor.
Recent Comments