Amidst today’s fast-paced and highly competitive business environment, it is crucial for investors and industry enthusiasts to conduct comprehensive company evaluations. In this article, we will delve into an extensive industry comparison, evaluating Broadcom (NASDAQ:AVGO) in comparison to its major competitors within the Semiconductors & Semiconductor Equipment industry. By analyzing critical financial metrics, market position, and growth potential, our objective is to provide valuable insights for investors and offer a deeper understanding of company’s performance in the industry.
Broadcom Background
Broadcom is one of the largest semiconductor companies in the world and has also expanded into infrastructure software. Its semiconductors primarily serve computing, wired connectivity, and wireless connectivity. It has a significant position in custom AI chips to train and run inference for large language models. It is primarily a fabless designer but holds some manufacturing in-house. In software, it sells virtualization, infrastructure, and security software to large enterprises, financial institutions, and governments. Broadcom is the product of consolidation. Its businesses are an amalgamation of former companies like legacy Broadcom and Avago Technologies in chips, as well as VMware, Brocade, CA Technologies, and Symantec in software.
| Company | P/E | P/B | P/S | ROE | EBITDA (in billions) | Gross Profit (in billions) | Revenue Growth |
|---|---|---|---|---|---|---|---|
| Broadcom Inc | 73.42 | 20.43 | 26.60 | 11.02% | $9.86 | $12.25 | 28.18% |
| NVIDIA Corp | 46.69 | 38.56 | 24.78 | 29.14% | $38.75 | $41.85 | 62.49% |
| Taiwan Semiconductor Manufacturing Co Ltd | 31.07 | 9.77 | 13.45 | 9.44% | $691.11 | $588.54 | 30.31% |
| Advanced Micro Devices Inc | 112.59 | 5.76 | 10.96 | 2.06% | $2.11 | $4.78 | 35.59% |
| Micron Technology Inc | 27.25 | 5.49 | 7.65 | 9.28% | $8.35 | $7.65 | 56.65% |
| Qualcomm Inc | 34.88 | 8.83 | 4.36 | -12.88% | $3.51 | $6.24 | 10.03% |
| Intel Corp | 602.67 | 1.62 | 2.98 | 3.98% | $7.85 | $5.22 | 2.78% |
| Texas Instruments Inc | 32.26 | 9.68 | 9.39 | 8.21% | $2.24 | $2.72 | 14.24% |
| Analog Devices Inc | 60.87 | 4.02 | 12.51 | 2.32% | $1.47 | $1.94 | 25.91% |
| ARM Holdings PLC | 143.01 | 15.98 | 26.95 | 3.3% | $0.22 | $1.11 | 34.48% |
| Marvell Technology Inc | 30.45 | 5.22 | 9.64 | 13.84% | $2.58 | $1.07 | 36.83% |
| NXP Semiconductors NV | 27.84 | 5.64 | 4.77 | 6.43% | $1.11 | $1.79 | -2.37% |
| Monolithic Power Systems Inc | 24.45 | 12.80 | 17.25 | 5.12% | $0.21 | $0.41 | 18.88% |
| ASE Technology Holding Co Ltd | 31.62 | 3.37 | 1.72 | 3.56% | $32.4 | $28.88 | 5.29% |
| First Solar Inc | 20.89 | 3.24 | 5.79 | 5.19% | $0.61 | $0.61 | 79.67% |
| Credo Technology Group Holding Ltd | 129.47 | 21.09 | 36.03 | 7.99% | $0.09 | $0.18 | 272.08% |
| STMicroelectronics NV | 45.03 | 1.30 | 2.06 | 1.33% | $0.31 | $1.06 | -1.97% |
| ON Semiconductor Corp | 75.45 | 2.80 | 3.72 | 3.22% | $0.44 | $0.59 | -11.98% |
| United Microelectronics Corp | 14.92 | 1.76 | 2.64 | 4.29% | $30.07 | $17.62 | -2.25% |
| Tower Semiconductor Ltd | 70.79 | 4.83 | 9.17 | 1.9% | $0.13 | $0.09 | 6.79% |
| Lattice Semiconductor Corp | 382.85 | 14.83 | 21.38 | 0.4% | $0.01 | $0.09 | 4.92% |
| Rambus Inc | 44.99 | 7.89 | 15.15 | 3.84% | $0.08 | $0.14 | 22.68% |
| Average | 94.76 | 8.78 | 11.54 | 5.33% | $39.22 | $33.93 | 33.38% |
Through a detailed examination of Broadcom, we can deduce the following trends:
-
The Price to Earnings ratio of 73.42 is 0.77x lower than the industry average, indicating potential undervaluation for the stock.
-
With a Price to Book ratio of 20.43, which is 2.33x the industry average, Broadcom might be considered overvalued in terms of its book value, as it is trading at a higher multiple compared to its industry peers.
-
The Price to Sales ratio of 26.6, which is 2.31x the industry average, suggests the stock could potentially be overvalued in relation to its sales performance compared to its peers.
-
With a Return on Equity (ROE) of 11.02% that is 5.69% above the industry average, it appears that the company exhibits efficient use of equity to generate profits.
-
The Earnings Before Interest, Taxes, Depreciation, and Amortization (EBITDA) of $9.86 Billion is 0.25x below the industry average, suggesting potential lower profitability or financial challenges.
-
The gross profit of $12.25 Billion is 0.36x below that of its industry, suggesting potential lower revenue after accounting for production costs.
-
The company’s revenue growth of 28.18% is significantly below the industry average of 33.38%. This suggests a potential struggle in generating increased sales volume.
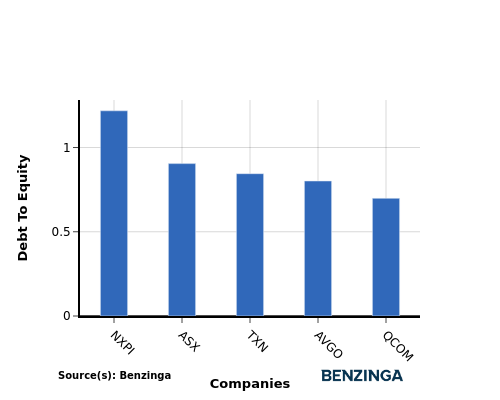
Debt To Equity Ratio

The debt-to-equity (D/E) ratio is a key indicator of a company’s financial health and its reliance on debt financing.
Considering the debt-to-equity ratio in industry comparisons allows for a concise evaluation of a company’s financial health and risk profile, aiding in informed decision-making.
In light of the Debt-to-Equity ratio, a comparison between Broadcom and its top 4 peers reveals the following information:
-
In the context of the debt-to-equity ratio, Broadcom holds a middle position among its top 4 peers.
-
This indicates a moderate level of debt relative to its equity with a debt-to-equity ratio of 0.8, which implies a relatively balanced financial structure with a reasonable debt-equity mix.
Key Takeaways
The PE, PB, and PS ratios for Broadcom indicate that it may be overvalued compared to its peers in the Semiconductors & Semiconductor Equipment industry. This is supported by the low PE ratio and high PB and PS ratios. On the other hand, Broadcom’s high ROE, low EBITDA, low gross profit, and low revenue growth suggest that the company may be facing challenges in generating profits and revenue compared to its industry peers.
This article was generated by Benzinga’s automated content engine and reviewed by an editor.
Recent Comments