Amidst today’s fast-paced and highly competitive business environment, it is crucial for investors and industry enthusiasts to conduct comprehensive company evaluations. In this article, we will delve into an extensive industry comparison, evaluating Clearwater Analytics Hldg (NYSE:CWAN) in comparison to its major competitors within the Software industry. By analyzing critical financial metrics, market position, and growth potential, our objective is to provide valuable insights for investors and offer a deeper understanding of company’s performance in the industry.
Clearwater Analytics Hldg Background
Clearwater Analytics describes its mission as aiming to be the world’s most trusted and comprehensive technology platform for the entire investment cycle. Clearwater has historically focused on back-office functions such as investment accounting, but with acquisitions such Enfusion, Beacon, and Bistro, the firm has broadened its focus with front-office and middle-office capabilities. Clearwater primarily serves insurance companies, asset managers, hedge funds, and corporate treasuries. Pro forma for Enfusion, about 76% of Clearwater’s revenue is generated in the US.
| Company | P/E | P/B | P/S | ROE | EBITDA (in billions) | Gross Profit (in billions) | Revenue Growth |
|---|---|---|---|---|---|---|---|
| Clearwater Analytics Holdings Inc | 15.45 | 3.57 | 10.64 | -0.52% | $0.04 | $0.13 | 77.08% |
| Pegasystems Inc | 40.80 | 17.81 | 6.89 | 7.1% | $0.03 | $0.28 | 17.32% |
| Manhattan Associates Inc | 49.41 | 33.90 | 10.02 | 19.94% | $0.08 | $0.16 | 3.42% |
| AppFolio Inc | 42.25 | 16.95 | 9.48 | 7.05% | $0.04 | $0.16 | 21.2% |
| InterDigital Inc | 21.98 | 7.67 | 11.89 | 6.17% | $0.11 | $0.14 | 27.98% |
| Open Text Corp | 17.46 | 2.13 | 1.67 | 3.72% | $0.44 | $0.94 | 1.51% |
| The Descartes Systems Group Inc | 50.06 | 4.94 | 11.09 | 2.88% | $0.08 | $0.15 | 11.21% |
| NICE Ltd | 12.70 | 1.79 | 2.48 | 3.82% | $0.21 | $0.49 | 6.09% |
| Hut 8 Corp | 27.05 | 3.93 | 8.65 | 3.7% | $0.11 | $0.13 | 279.55% |
| Life360 Inc | 181.76 | 13.47 | 12.06 | 2.58% | $0.01 | $0.1 | 34.06% |
| Riot Platforms Inc | 26.29 | 1.45 | 8.89 | 3.07% | $0.2 | $0.07 | 112.57% |
| ACI Worldwide Inc | 19.71 | 3.39 | 2.97 | 6.35% | $0.16 | $0.26 | 6.78% |
| Average | 44.5 | 9.77 | 7.83 | 6.03% | $0.13 | $0.26 | 47.43% |
When conducting a detailed analysis of Clearwater Analytics Hldg, the following trends become clear:
-
At 15.45, the stock’s Price to Earnings ratio is 0.35x less than the industry average, suggesting favorable growth potential.
-
With a Price to Book ratio of 3.57, significantly falling below the industry average by 0.37x, it suggests undervaluation and the possibility of untapped growth prospects.
-
The Price to Sales ratio of 10.64, which is 1.36x the industry average, suggests the stock could potentially be overvalued in relation to its sales performance compared to its peers.
-
The company has a lower Return on Equity (ROE) of -0.52%, which is 6.55% below the industry average. This indicates potential inefficiency in utilizing equity to generate profits, which could be attributed to various factors.
-
With lower Earnings Before Interest, Taxes, Depreciation, and Amortization (EBITDA) of $40 Million, which is 0.31x below the industry average, the company may face lower profitability or financial challenges.
-
With lower gross profit of $130 Million, which indicates 0.5x below the industry average, the company may experience lower revenue after accounting for production costs.
-
The company’s revenue growth of 77.08% exceeds the industry average of 47.43%, indicating strong sales performance and market outperformance.
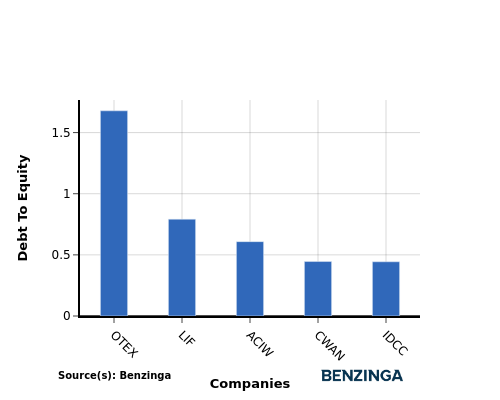
Debt To Equity Ratio

The debt-to-equity (D/E) ratio is an important measure to assess the financial structure and risk profile of a company.
Considering the debt-to-equity ratio in industry comparisons allows for a concise evaluation of a company’s financial health and risk profile, aiding in informed decision-making.
When examining Clearwater Analytics Hldg in comparison to its top 4 peers with respect to the Debt-to-Equity ratio, the following information becomes apparent:
-
As Clearwater Analytics Hldg is in the middle of the list in terms of the debt-to-equity ratio, it suggests that the company has a moderate debt-to-equity ratio of 0.45 compared to the other companies.
-
This position indicates a relatively balanced financial structure, where the company maintains a reasonable level of debt while also leveraging equity for financing its operations.
Key Takeaways
The PE, PB, and PS ratios for Clearwater Analytics Hldg indicate that it is undervalued compared to its peers in the Software industry. However, the low ROE, EBITDA, and gross profit suggest that the company may be facing operational challenges. On a positive note, the high revenue growth rate shows potential for future performance improvement. In summary, Clearwater Analytics Hldg’s valuation metrics suggest a mixed outlook compared to its industry peers.
This article was generated by Benzinga’s automated content engine and reviewed by an editor.
Recent Comments