Bitcoin (CRYPTO: BTC) climbed back above $122,000 on Wedneday, reigniting debate over whether the largest cryptocurrency can sustain momentum or risks following Ethereum (CRYPTO: ETH) and XRP (CRYPTO: XRP) into failed breakout territory.
Bitcoin Price Hits Critical Resistance Zone
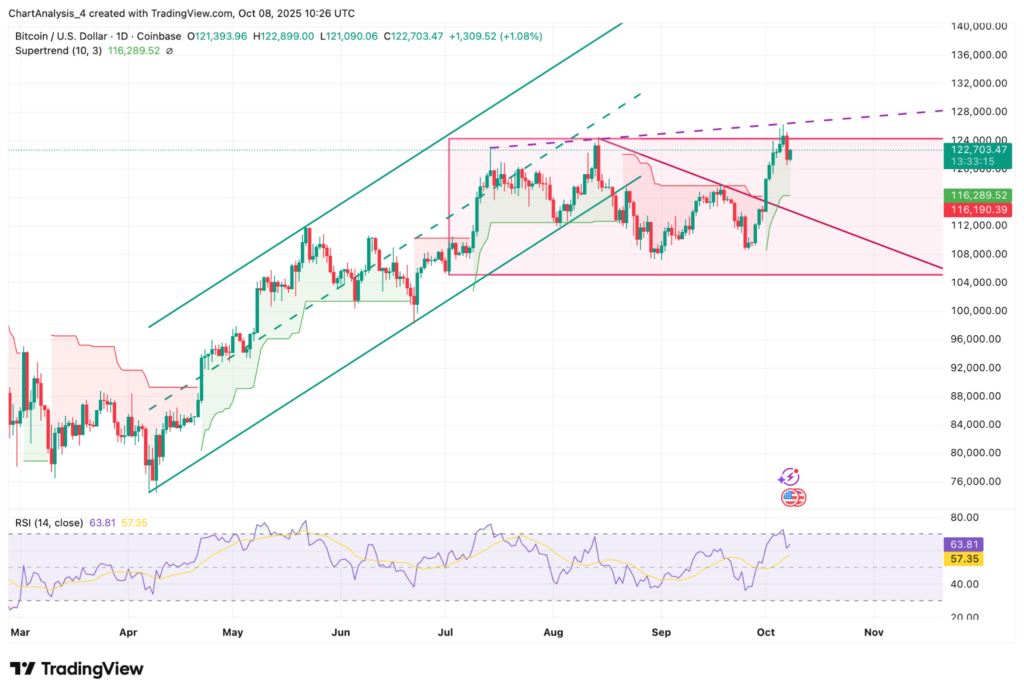
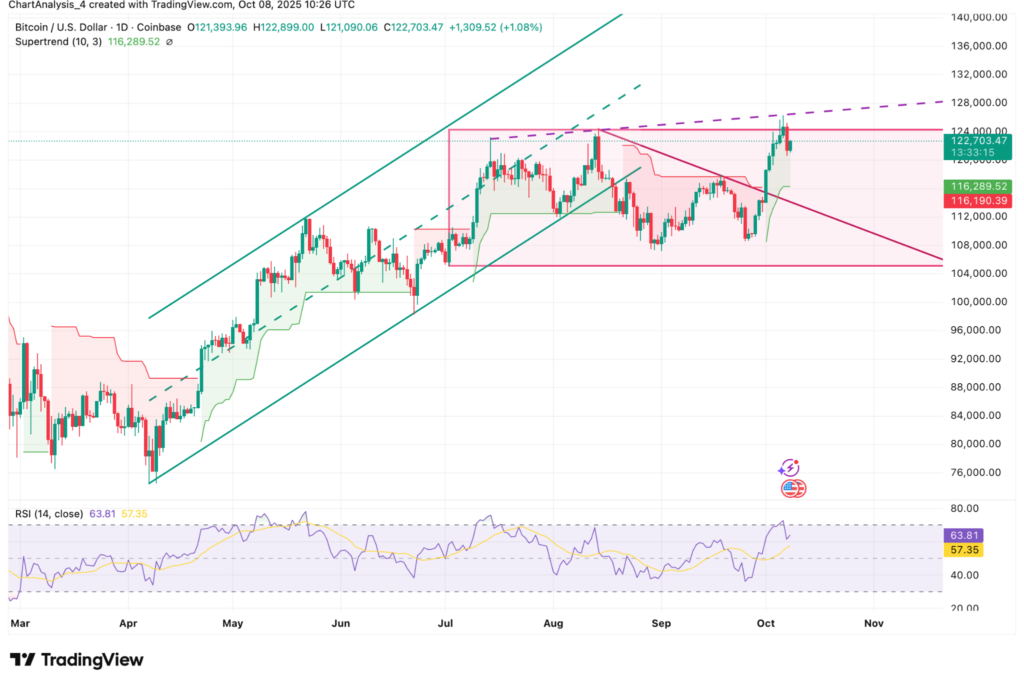
BTC Technical Analysis (Source: TradingView)
The daily chart shows Bitcoin breaking out of a two-week consolidation, pushing into the $122,000–$124,000 resistance band.
This region aligns with the upper boundary of the summer trading range and a descending trendline that has capped rallies since July.
The Supertrend indicator remains bullish above $116,000, while the RSI at 63 shows underlying strength without signaling exhaustion.
On-chain data from Coinglass recorded $69.8 million in exchange outflows, a bullish sign implying fewer coins available for immediate selling.
Such withdrawal behavior often precedes sustained uptrends and contrasts with prior local tops marked by sharp inflow spikes.
Ethereum And XRP Price Action Signals Weakness
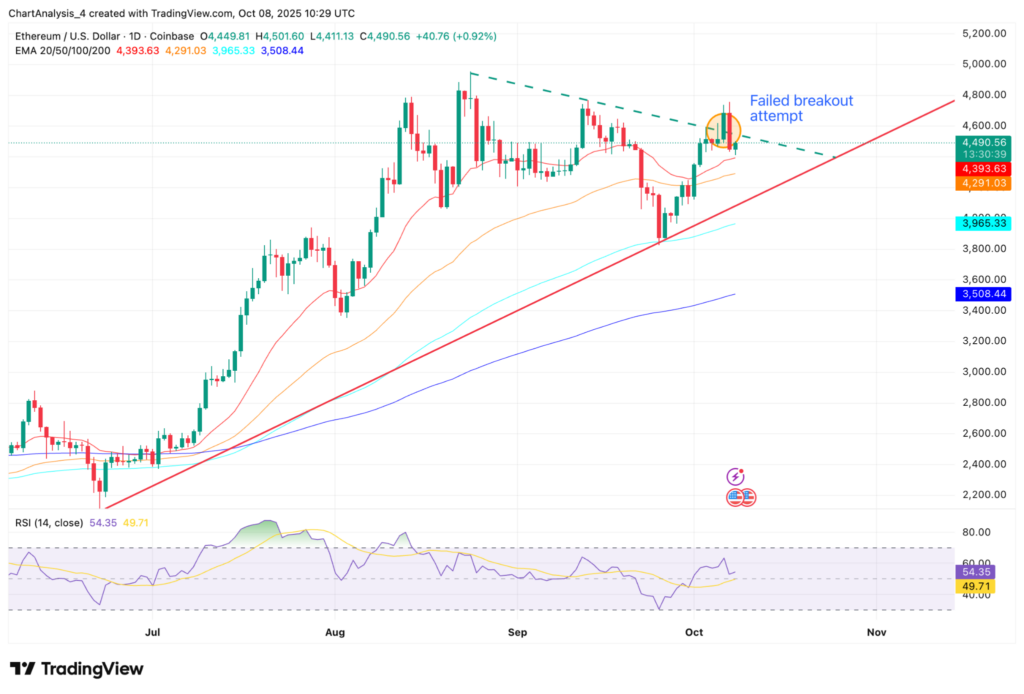
ETH Failed Breakout Attempt (Source: TradingView)
Ethereum price briefly pierced resistance near $4,700 last week before slipping back below its descending trendline.
That rejection has turned into a failed breakout, with ETH now vulnerable to retests of $4,300 and potentially $4,000.
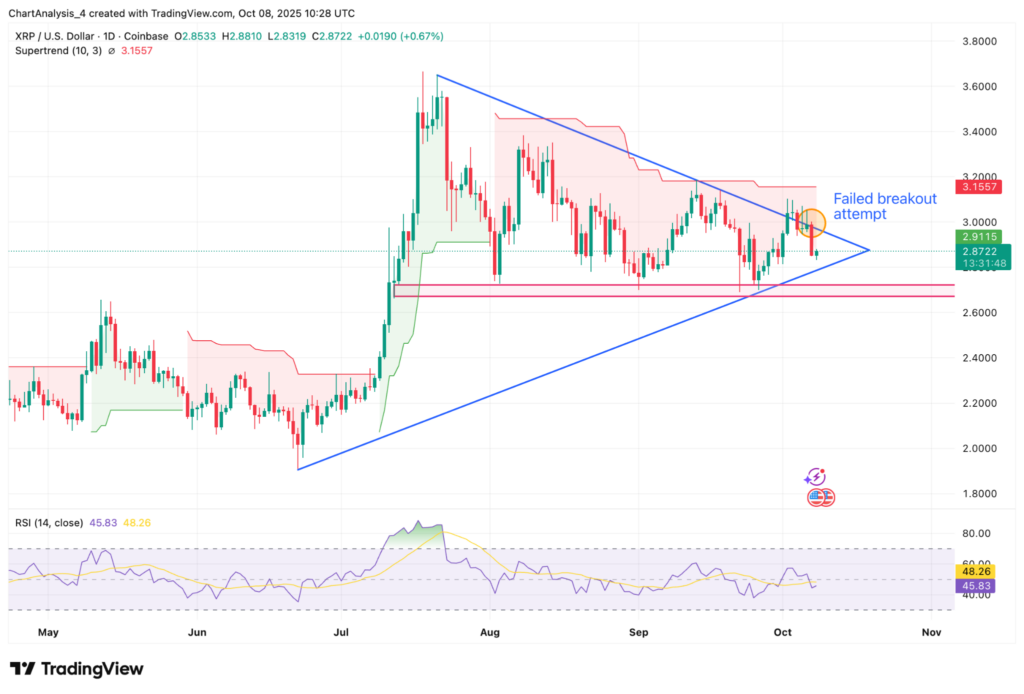
XRP Failed Breakout Attempt (Source: TradingView)
XRP price followed a similar trajectory. After breaking above $3.00, the token reversed into its symmetrical triangle, now hovering closer to $2.70 support.
Both reversals highlight how weak liquidity conditions can amplify resistance rejection, trapping momentum buyers and fueling pullbacks.
For Bitcoin, the concern is whether history will rhyme — a rejection at $124,000 could drag price back toward $116,000, where the Supertrend and mid-range supports converge.
Bitcoin Price Prediction: Breakout Or Breakdown
Traders are watching $121,000 as the key short-term line in the sand.
A daily close above $124,000 would confirm breakout validity, opening targets toward $128,000 and $132,000.
However, failure to hold current levels could invite a broader correction toward the $104,000–$116,000 range.
The next few sessions will determine whether Bitcoin breaks the pattern or joins ETH and XRP in another round of failed rallies.
As liquidity thins across markets, conviction-driven flows and spot demand will likely decide whether BTC extends its run or pauses beneath resistance.
Read Next:
Image: Shutterstock
Recent Comments