
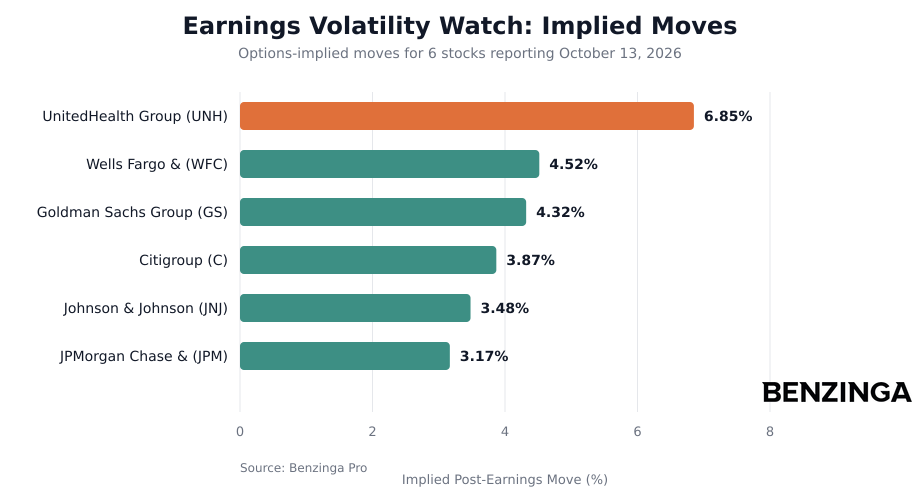
Earnings season keeps the tape honest, and the options market is already laying down markers for how much volatility traders expect when results hit on Tuesday, before the opening bell. For retail investors, implied moves can be a quick way to sanity-check risk — not just for the stock you own, but for the size of the swing the market is bracing for, according to Benzinga Pro.
This is a Benzinga-selected watchlist heavy on big banks, with a pair of healthcare bellwethers mixed in. The marquee name on the list is JPMorgan Chase, but the largest implied move is saved for the final section as the countdown runs from the calmest setup to the most volatile.
6. JPMorgan Chase | Mkt Cap: $885B | Implied Move: 3.17%
JPMorgan Chase & Co. (NYSE:JPM) reports third quarter of 2026 results, with Wall Street looking for $5.90 in earnings per share on $51.26 billion in revenue. That would top last year’s $5.07 per share on $47.12 billion.
Benzinga Pro data show options are pricing in a 3.17% move around the print. Even with the smallest implied swing on this Benzinga-selected list, that still translates to $28 billion of market value at stake given JPMorgan Chase’s $885 billion market cap.
JPMorgan Chase & is one of the world’s largest financial services firms, with a $5 trillion balance sheet and $2.71 trillion in deposits as of June 2026 — so investors tend to treat its quarter as a read-through on everything from consumer credit to capital markets activity. The stock carries a Buy consensus rating, and the stock is trading below the 180-day average analyst price forecast; in October, TD Cowen maintained a Hold rating, while UBS reiterated its Buy rating and cut its price forecast.
Shares have rallied in 2026, up 2.3% year-to-date and trading 3.7% above the 200-day moving average heading into the report.
5. Johnson & Johnson | Mkt Cap: $630B | Implied Move: 3.48%
Johnson & Johnson (NYSE:JNJ) reports third quarter of 2026 results, and the consensus view calls for $2.53 in earnings per share on $25.25 billion in revenue. A year ago, Johnson & Johnson posted $2.80 per share on $23.99 billion.
The options market is implying a 3.48% move, according to Benzinga Pro. With a $630 billion market cap, that’s $21.9 billion of market value at stake — a meaningful swing for a company investors often treat as a steadier healthcare holding.
Johnson & Johnson now operates with two main engines — innovative medicine and medtech — following the divestment of its consumer business, Kenvue, in 2023. The stock carries a Buy consensus rating and the share price sits below the 180-day average analyst price forecast; in October, RBC Capital reiterated its Outperform rating and raised its price forecast, and Citigroup reiterated its Buy rating and raised its price forecast.
Johnson & Johnson has been a standout on the tape in 2026, up 26.1% year-to-date and trading 7.6% above the 200-day moving average. The shares sit about 42% above the 52-week low of $184.66.
4. Citigroup | Mkt Cap: $217B | Implied Move: 3.87%
Citigroup Inc. (NYSE:C) reports third quarter of 2026 results, with consensus expectations for $2.66 in earnings per share on $23.72 billion in revenue. That compares with $2.24 per share on $22.09 billion in the prior-year quarter.
According to Benzinga Pro, options are pricing in a 3.87% move. For Citigroup’s $217 billion market cap, that puts about $8.41 billion of market value at stake — a smaller dollar figure than the megacaps, but still a sizable implied reaction for a global bank.
Citigroup sits at the center of global money movement, handling more than $6 trillion in daily transaction volume for multinational clients, which keeps investors focused on trading, investment banking, and credit trends all at once. The stock carries a Buy consensus rating, and the 180-day average analyst price forecast is above where the stock trades; in October, TD Cowen maintained a Buy rating, while UBS reiterated its Neutral rating and cut its price forecast.
Citigroup has rallied in 2026, up 9.2% year-to-date and trading 3% above the 200-day moving average. The shares sit about 39% above the 52-week low of $93.66.
3. Goldman Sachs | Mkt Cap: $264B | Implied Move: 4.32%
Goldman Sachs Group Inc. (NYSE:GS) reports third quarter of 2026 results, and the Street is modeling $13.03 in earnings per share on $16.71 billion in revenue. Goldman Sachs Group earned $12.25 per share on $15.18 billion in revenue in the year-ago period.
Benzinga Pro data show the options market is implying a 4.32% move. With Goldman Sachs Group valued at $264 billion, that suggests roughly $11.4 billion of market value at stake as investors handicap the quarter.
Goldman Sachs Group is best known as a leading global investment bank, so the earnings narrative often hinges on the pace of dealmaking, underwriting, and trading activity. The stock carries a Buy consensus rating and shares trade below the 180-day average analyst price forecast; in October, TD Cowen initiated coverage with a Buy rating, while UBS reiterated its Neutral rating and cut its price forecast.
The stock has pulled back in 2026, down 2.1% year-to-date and trading 6.4% below the 200-day moving average. The shares sit about 22% below the 52-week high of $1153.99.
2. Wells Fargo | Mkt Cap: $253B | Implied Move: 4.52%
Wells Fargo & Co. (NYSE:WFC) reports third quarter of 2026 results, with analysts calling for $1.85 in earnings per share on $22.32 billion in revenue. In the prior-year quarter, Wells Fargo & delivered $1.73 per share on $21.44 billion.
Options traders are pricing in a 4.52% move, according to Benzinga Pro. On Wells Fargo &’s $253 billion market cap, that implies about $11.4 billion of market value at stake — one of the larger volatility setups in this Benzinga-selected lineup.
Wells Fargo & is a North America-focused banking giant with a $2.3 trillion balance sheet and the third-highest deposit market share in the U.S., which keeps attention on net interest income, credit quality, and expense discipline. The stock carries a Buy consensus rating and the stock is trading below the 180-day average analyst price forecast; in October, TD Cowen maintained a Buy rating, and UBS reiterated its Buy rating and cut its price forecast.
Wells Fargo & has pulled back in 2026, down 12.2% year-to-date, trading 0.9% below the 200-day moving average after the 50-day moving average crossed above the 200-day in August.
1. UnitedHealth Group | Mkt Cap: $340B | Implied Move: 6.85%
UnitedHealth Group Inc. (NYSE:UNH) reports third quarter of 2026 results, with consensus estimates calling for $4.15 in earnings per share on $111.40 billion in revenue. That compares with $2.92 per share on $113.16 billion in the year-ago quarter.
Benzinga Pro data show options are pricing in a 6.85% move — the widest implied move on this list. With UnitedHealth Group’s market cap at $340 billion, that’s $23.3 billion of market value at stake as traders brace for a potentially sharp reaction to results and outlook.
UnitedHealth Group is one of the largest private health insurers, providing medical benefits to about 51 million members globally as of December 2025, which makes the quarter a focal point for medical cost trends and membership dynamics. The stock carries a Buy consensus rating and the share price sits below the 180-day average analyst price forecast; in October, TD Cowen reiterated its Hold rating and cut its price forecast, while in July, JP Morgan reiterated its Overweight rating and raised its price target.
UnitedHealth Group has rallied in 2026, up 12.8% year-to-date and trading 6.5% above the 200-day moving average. The shares sit about 18% below the 52-week high of $461.62.
Photo: g0d4ather from Shutterstock
Recent Comments