
Earnings are back in focus on Thursday, with a Benzinga-selected watchlist that spans defense, wireless, life sciences, gold mining and semiconductors. With guidance and segment commentary often moving stocks as much as the headline numbers, options markets are already laying down a roadmap for how volatile each print could be, according to Benzinga Pro.
The marquee name on this list is Intel, but the biggest implied swing is saved for the final section as the countdown runs from the calmest setup to the most volatile.
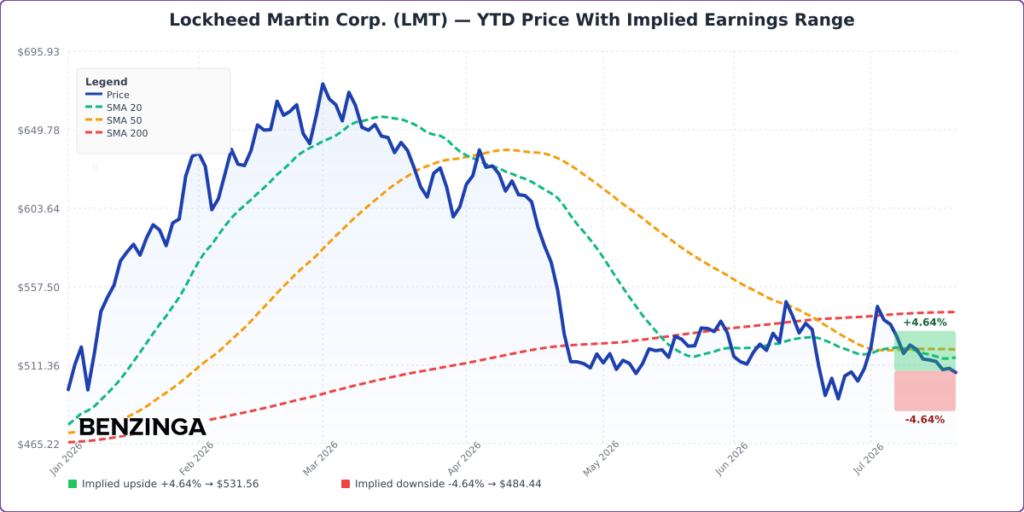
5. Lockheed Martin Corp. | Mkt Cap: $117B | Implied Move: 4.64%
Lockheed Martin Corp. (NYSE:LMT) reports second quarter of 2026 results before the opening bell. Wall Street is looking for $7.23 in earnings per share on $19.37 billion in revenue, compared with $7.29 on $18.16 billion a year ago.
Benzinga Pro data show options are pricing in a 4.64% move around the report. On a $117 billion market cap, that implies about $5.43 billion of market value at stake as investors weigh defense demand and program execution.
Lockheed Martin is the world’s largest defense contractor and a key player in high-end fighter aircraft after winning the F-35 Joint Strike Fighter program in 2001. The stock carries a Hold consensus rating, and the stock is trading below the 180-day average analyst price forecast; in July, TD Cowen reiterated its Hold rating and cut its price forecast, while forecast upgraded the stock to Buy and raised its price forecast.
Lockheed Martin has eked out gains in 2026, up 2.0% year-to-date, but it’s trading 6.4% below the 200-day moving average after the 50-day moving average crossed below the 200-day in June. The shares sit about 27% below the 52-week high of $692.00.

4. T-Mobile US, Inc. | Mkt Cap: $207B | Implied Move: 5.95%
T-Mobile US, Inc. (NASDAQ:TMUS) reports second quarter of 2026 results before the opening bell. Consensus estimates call for $2.58 in earnings per share on $22.98 billion in revenue, versus $2.84 on $21.13 billion in the prior-year quarter.
Options traders are implying a 5.95% move, according to Benzinga Pro. With a $207 billion market cap, that’s roughly $12.3 billion of market value in play as investors parse subscriber trends and profitability.
T-Mobile US became the second-largest wireless carrier in the U.S. after Deutsche Telekom merged its T-Mobile USA unit with MetroPCS in 2013 and later combined with Sprint in 2020. The stock carries a Buy consensus rating, and the share price sits well below the 180-day average analyst price forecast; in July, RBC Capital reiterated its Outperform rating and cut its price forecast and Scotiabank reiterated its Sector Outperform rating and cut its price forecast.
T-Mobile US has drifted lower into the print, down 4.4% year-to-date and trading 5.0% below the 200-day moving average. The shares sit about 27% below the 52-week high of $261.56.

3. Thermo Fisher Scientific, Inc. | Mkt Cap: $198B | Implied Move: 6.04%
Thermo Fisher Scientific, Inc. (NYSE:TMO) reports second quarter of 2026 results before the opening bell. The Street is modeling $5.71 in earnings per share on $11.70 billion in revenue, up from $5.36 on $10.86 billion a year earlier.
According to Benzinga Pro, the options market is implying a 6.04% move. With a $198 billion market cap, that translates to about $12 billion of market value at stake as investors look for signals across instruments, consumables and diagnostics demand.
Thermo Fisher Scientific sells scientific instruments and laboratory equipment, diagnostics consumables, and life science reagents. The stock carries a Buy consensus rating, and the 180-day average analyst price forecast is above where the stock trades; in July, Evercore ISI Group reiterated its Outperform rating and cut its price forecast, while Bernstein maintained a Market Perform rating in June.
Thermo Fisher Scientific has pulled back in 2026, down 11.7% year-to-date, and it’s hovering 0.8% below the 200-day moving average after the 50-day moving average crossed below the 200-day in April. The shares sit about 18% below the 52-week high of $643.99.

2. Newmont Corp. | Mkt Cap: $101B | Implied Move: 6.36%
Newmont Corp. (NYSE:NEM) reports second quarter of 2026 results after the closing bell. Analysts expect $2.18 in earnings per share on $6.38 billion in revenue, compared with $1.43 on $5.32 billion in the year-ago quarter.
Benzinga Pro shows options are pricing in a 6.36% move around earnings. For a $101 billion company, that implies about $6.4 billion of market value at stake as traders handicap the quarter’s production and cost picture.
Newmont is the world’s largest gold miner, having bought Goldcorp in 2019, formed a Nevada joint venture with Barrick later that year, and purchased Newcrest in November 2023. The stock carries a Buy consensus rating, and shares trade well below the 180-day average analyst price forecast; in July, Barclays reiterated its Overweight rating and cut its price forecast, and TD Cowen upgraded the stock to Buy and cut its price forecast.
Newmont has slid this year, down 8.6% year-to-date and trading 9.2% below the 200-day moving average after the 50-day moving average crossed below the 200-day in July. The shares sit about 30% below the 52-week high of $134.88.

1. Intel Corp | Mkt Cap: $516B | Implied Move: 13.22%
Intel Corp (NASDAQ:INTC) reports second quarter of 2026 results after the closing bell. Wall Street is calling for 19 cents in earnings per share on $14.40 billion in revenue, compared with a 10 cent per share loss on $12.86 billion a year ago.
According to Benzinga Pro, options are pricing in a 13.22% move — the widest implied swing on this Benzinga-selected list. With a $516 billion market cap, that’s about $68.3 billion of market value at stake as investors weigh the quarter’s trajectory and what comes next.
Intel designs and manufactures microprocessors for the global personal computer and data center markets, putting the spotlight on demand signals and competitive positioning. The stock carries a Hold consensus rating, and the stock is trading above the 180-day average analyst price forecast; in July, Morgan Stanley, Susquehanna and Keybanc raised their price forecasts.
Intel has been the clear momentum name into earnings, up 167.8% year-to-date and trading 58.4% above the 200-day moving average. Even after that run, the shares sit about 28% below the 52-week high of $142.35.

Image via Shutterstock
Recent Comments