
In today’s rapidly changing and highly competitive business world, it is vital for investors and industry enthusiasts to carefully assess companies. In this article, we will perform a comprehensive industry comparison, evaluating Netflix (NASDAQ:NFLX) against its key competitors in the Entertainment industry. By analyzing important financial metrics, market position, and growth prospects, we aim to provide valuable insights for investors and shed light on company’s performance within the industry.
Netflix Background
Netflix’s relatively simple business model involves only one business, its streaming service. It has the biggest television entertainment subscriber base in both the United States and the collective international market, with more than 300 million subscribers globally. Netflix has exposure to nearly the entire global population outside of China. The firm has traditionally avoided a regular slate of live programming or sports content, instead focusing on on-demand access to episodic television, movies, and documentaries. The firm introduced ad-supported subscription plans in 2022, giving the firm exposure to the advertising market in addition to the subscription fees that have historically accounted for nearly all its revenue.
| Company | P/E | P/B | P/S | ROE | EBITDA (in billions) | Gross Profit (in billions) | Revenue Growth |
|---|---|---|---|---|---|---|---|
| Netflix Inc | 21.59 | 9.48 | 6.11 | 11.1% | $8.66 | $6.52 | 13.37% |
| The Walt Disney Co | 15.38 | 1.54 | 1.77 | 2.07% | $5.25 | $9.27 | 6.55% |
| Spotify Technology SA | 33.60 | 11.12 | 5.20 | 8.83% | $0.97 | $1.5 | 8.19% |
| Liberty Media Corp | 39.35 | 2.92 | 4.92 | 0.74% | $0.24 | $0.3 | 59.06% |
| Roku Inc | 106.87 | 8.01 | 4.42 | 3.22% | $0.17 | $0.56 | 22.36% |
| Warner Music Group Corp | 33.25 | 19.74 | 2.05 | 24.55% | $0.4 | $0.8 | 16.71% |
| TKO Group Holdings Inc | 67.55 | 4.03 | 7.08 | 2.51% | $0.49 | $0.86 | 25.86% |
| Sphere Entertainment Co | 47.88 | 2.26 | 4.85 | -0.07% | $0.09 | $0.22 | 37.72% |
| Cinemark Holdings Inc | 24.22 | 9.65 | 1.30 | -1.63% | $0.08 | $0.42 | 18.94% |
| Madison Square Garden Entertainment Corp | 74.23 | 75.35 | 3.60 | 12.16% | $0.03 | $0.1 | 1.57% |
| Imax Corp | 56.49 | 6.21 | 5.23 | 1.26% | $0.03 | $0.05 | -6.1% |
| Marcus Corp | 53.75 | 1.65 | 0.96 | -3.42% | $-0.0 | $0.05 | 3.79% |
| Average | 50.23 | 12.95 | 3.76 | 4.57% | $0.7 | $1.28 | 17.7% |
By conducting an in-depth analysis of Netflix, we can identify the following trends:
-
The stock’s Price to Earnings ratio of 21.59 is lower than the industry average by 0.43x, suggesting potential value in the eyes of market participants.
-
With a Price to Book ratio of 9.48, significantly falling below the industry average by 0.73x, it suggests undervaluation and the possibility of untapped growth prospects.
-
With a relatively high Price to Sales ratio of 6.11, which is 1.63x the industry average, the stock might be considered overvalued based on sales performance.
-
The Return on Equity (ROE) of 11.1% is 6.53% above the industry average, highlighting efficient use of equity to generate profits.
-
The company has higher Earnings Before Interest, Taxes, Depreciation, and Amortization (EBITDA) of $8.66 Billion, which is 12.37x above the industry average, indicating stronger profitability and robust cash flow generation.
-
With higher gross profit of $6.52 Billion, which indicates 5.09x above the industry average, the company demonstrates stronger profitability and higher earnings from its core operations.
-
The company is witnessing a substantial decline in revenue growth, with a rate of 13.37% compared to the industry average of 17.7%, which indicates a challenging sales environment.
Debt To Equity Ratio

The debt-to-equity (D/E) ratio is a key indicator of a company’s financial health and its reliance on debt financing.
Considering the debt-to-equity ratio in industry comparisons allows for a concise evaluation of a company’s financial health and risk profile, aiding in informed decision-making.
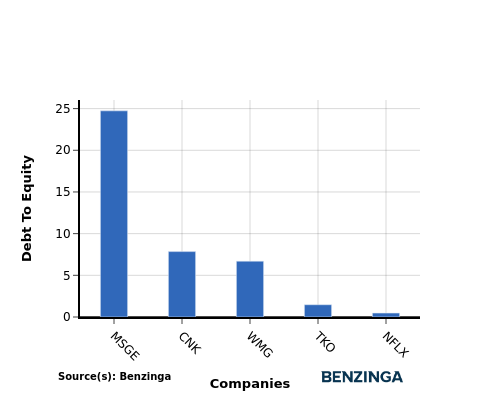
When assessing Netflix against its top 4 peers using the Debt-to-Equity ratio, the following comparisons can be made:
-
When comparing the debt-to-equity ratio, Netflix is in a stronger financial position compared to its top 4 peers.
-
The company has a lower level of debt relative to its equity, indicating a more favorable balance between the two with a lower debt-to-equity ratio of 0.47.
Key Takeaways
For Netflix, the PE and PB ratios suggest the stock is undervalued compared to peers, indicating potential for growth. However, the high PS ratio implies the stock may be overvalued based on revenue. In terms of ROE, EBITDA, and gross profit, Netflix outperforms peers, indicating strong profitability and operational efficiency. The low revenue growth rate may be a concern for future performance compared to industry peers.
This article was generated by Benzinga’s automated content engine and reviewed by an editor.
Recent Comments