
In the ever-changing and fiercely competitive business landscape, conducting thorough company analysis is crucial for investors and industry experts. In this article, we will undertake a comprehensive industry comparison, evaluating Ondas (NASDAQ:ONDS) and its primary competitors in the Communications Equipment industry. By closely examining key financial metrics, market position, and growth prospects, our aim is to provide valuable insights for investors and shed light on company’s performance within the industry.
Ondas Background
Ondas Inc designs, develops, manufactures, sells, and supports FullMAX Software Defined Radio (SDR) technology in the United States, Israel, and India. The company operates in two business segments namely Ondas Networks and Ondas Autonomous Systems. The company generates maximum revenue from Ondas Autonomous Systems through the sales of the Optimus system and separately priced support, maintenance, and ancillary services related to the sale of the Optimus system. Geographically, the company operates in Israel, Germany, United Arab Emirates, United States, and Other Countries. It derives maximum revenue from Israel.
| Company | P/E | P/B | P/S | ROE | EBITDA (in billions) | Gross Profit (in billions) | Revenue Growth |
|---|---|---|---|---|---|---|---|
| Ondas Inc | 85.11 | 4.06 | 24.66 | 47.84% | $0.37 | $0.02 | 1079.9% |
| Cisco Systems Inc | 37.39 | 9.05 | 7.36 | 6.98% | $5.05 | $10.08 | 11.96% |
| Motorola Solutions Inc | 32.76 | 26.51 | 5.77 | 14.78% | $0.69 | $1.36 | 7.36% |
| Lumentum Holdings Inc | 147.46 | 21.92 | 28.12 | 7.46% | $0.26 | $0.36 | 90.12% |
| Ciena Corp | 136.24 | 20 | 10.68 | 7.68% | $0.3 | $0.69 | 39.51% |
| Ubiquiti Inc | 34.47 | 26.98 | 10.48 | 21.09% | $0.3 | $0.37 | 18.67% |
| F5 Inc | 33.56 | 6.32 | 7.36 | 4.11% | $0.2 | $0.66 | 11.02% |
| Extreme Networks Inc | 253.50 | 50.38 | 3.24 | 12.11% | $0.02 | $0.2 | 11.38% |
| NetScout Systems Inc | 32.12 | 1.81 | 3.56 | 1.11% | $0.03 | $0.16 | -0.95% |
| Vistance Networks Inc | 18.35 | 0.61 | 1.37 | 306.72% | $0.07 | $0.23 | 21.57% |
| Digi International Inc | 59.10 | 3.78 | 5.37 | 1.72% | $0.03 | $0.08 | 25.11% |
| Calix Inc | 76.47 | 3.24 | 2.47 | 1.4% | $0.02 | $0.16 | 27.13% |
| Harmonic Inc | 155.81 | 3.81 | 3.53 | 1.98% | $0.02 | $0.06 | 43.38% |
| Ituran Location and Control Ltd | 18.87 | 5.47 | 3.04 | 7.89% | $0.03 | $0.05 | 18.75% |
| Gilat Satellite Networks Ltd | 22.38 | 1.64 | 1.62 | 1.01% | $0.01 | $0.04 | 20.03% |
| Clearfield Inc | 139.13 | 1.79 | 2.97 | -0.21% | $-0.0 | $0.01 | -15.34% |
| Ribbon Communications Inc | 13.35 | 0.95 | 0.49 | -7.95% | $-0.02 | $0.07 | -10.3% |
| Average | 75.69 | 11.52 | 6.09 | 24.24% | $0.44 | $0.91 | 19.96% |
Through a detailed examination of Ondas, we can deduce the following trends:
-
The Price to Earnings ratio of 85.11 for this company is 1.12x above the industry average, indicating a premium valuation associated with the stock.
-
Considering a Price to Book ratio of 4.06, which is well below the industry average by 0.35x, the stock may be undervalued based on its book value compared to its peers.
-
With a relatively high Price to Sales ratio of 24.66, which is 4.05x the industry average, the stock might be considered overvalued based on sales performance.
-
The Return on Equity (ROE) of 47.84% is 23.6% above the industry average, highlighting efficient use of equity to generate profits.
-
With lower Earnings Before Interest, Taxes, Depreciation, and Amortization (EBITDA) of $370 Million, which is 0.84x below the industry average, the company may face lower profitability or financial challenges.
-
Compared to its industry, the company has lower gross profit of $20 Million, which indicates 0.02x below the industry average, potentially indicating lower revenue after accounting for production costs.
-
The company is experiencing remarkable revenue growth, with a rate of 1079.9%, outperforming the industry average of 19.96%.
Debt To Equity Ratio

The debt-to-equity (D/E) ratio is a key indicator of a company’s financial health and its reliance on debt financing.
Considering the debt-to-equity ratio in industry comparisons allows for a concise evaluation of a company’s financial health and risk profile, aiding in informed decision-making.
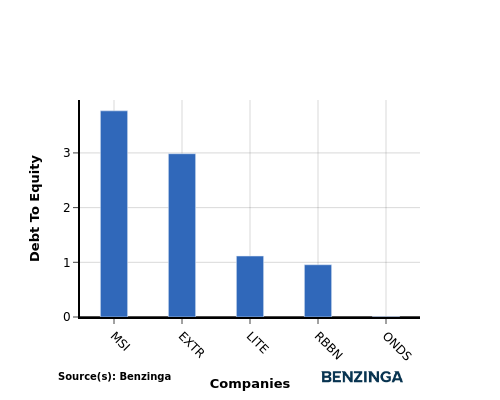
In light of the Debt-to-Equity ratio, a comparison between Ondas and its top 4 peers reveals the following information:
-
Ondas demonstrates a stronger financial position compared to its top 4 peers in the sector.
-
With a lower debt-to-equity ratio of 0.01, the company relies less on debt financing and maintains a healthier balance between debt and equity, which can be viewed positively by investors.
Key Takeaways
For Ondas in the Communications Equipment industry, the PE ratio is high compared to peers, indicating potential overvaluation. The PB ratio is low, suggesting undervaluation relative to industry standards. The PS ratio is high, signaling a premium placed on the company’s revenue. In terms of ROE, Ondas demonstrates strong profitability compared to peers. However, its EBITDA and gross profit are lower, indicating potential operational challenges. Ondas shows high revenue growth potential compared to industry peers.
This article was generated by Benzinga’s automated content engine and reviewed by an editor.
Recent Comments