Last quarter, Oracle Corp. (NYSE:ORCL) posted the largest order backlog in its history and beat Wall Street on both revenue and earnings, yet its stock is now on track for its worst month since 2001.
The collapse follows the strongest month in a generation. In May, Oracle surged 39.9%, its best monthly performance since February 2000, as the AI backlog story sent the stock to records.
The reversal has been just as violent.

Oracle Is Now A Cash-Burning Machine
The latest Oracle’s fiscal fourth-quarter results, released June 10, read like a record on every line that measures growth.
Total revenue rose 21% to $19.2 billion. Cloud revenue jumped 47% to $9.9 billion, led by a 93% surge in cloud infrastructure. Non-GAAP earnings came in at $2.11 a share, up 24% and ahead of estimates.
The headline number was the backlog. Remaining performance obligations, the contracted revenue Oracle has yet to recognize, ended the quarter at $638 billion, up 363% from a year earlier and $85 billion higher than just three months before.
More than half of that backlog is tied to a single customer: OpenAI.
Then the stock sold off anyway.
The same buildout filling Oracle’s order book is draining its cash.
Capital spending jumped 162% to $55.7 billion in fiscal 2026, overshooting the company’s own $50 billion guidance. The result pushed free cash flow to a negative $23.7 billion, ballooning from a deficit of just $394 million the year before.
Here is why that matters.
Every data center Oracle builds turns into depreciation, a non-cash expense that still flows through the income statement and weighs on margins. That depreciation line nearly doubled in the year to $7.62 billion.
To keep funding the expansion, Oracle guided to roughly $70 billion of net capital spending in fiscal 2027 and a fresh $40 billion in debt and equity, including a $20 billion stock sale that would dilute existing shareholders.
Oracle’s total debt already sits above $100 billion.
The timing makes the math harder.
With the Federal Reserve now signaling higher rates rather than cuts, the cost of funding a buildout this size only rises, and the future profits investors are being asked to wait for are worth less today.
A Monthly Drop This Deep Has Happened Only Nine Times In ORCL History
Strip away the fundamentals and the chart alone is a rare event.
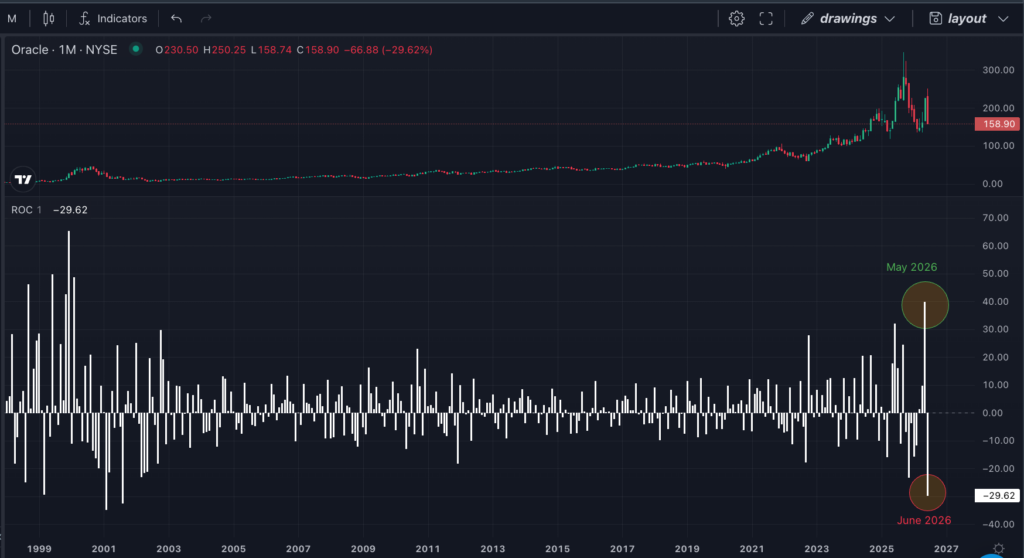
Since its 1986 IPO, Oracle has fallen 25% or more in a single month only 10 times — most recently in June 2026, down about 29%.
The last time the stock fell this hard in a single month was August 2001, near the bottom of the dot-com collapse.
So what happened after the previous nine?
| Date | Oracle Monthly Move % | +1M Return | 3M Return | 6M Return | 12M Return |
|---|---|---|---|---|---|
| July 1986 | -36.41% | 6.45% | 16.13% | 74.20% | 193.55% |
| July 1990 | -27.03% | -61.48% | -53.33% | -46.67% | -33.33% |
| August 1990 | -31.11% | -44.09% | -32.26% | -22.58% | -3.23% |
| September 1990 | -44.09% | 21.15% | 21.15% | 42.31% | 142.31% |
| March 1992 | -32.50% | 10.19% | 37.96% | 64.81% | 163.89% |
| December 1997 | -33.02% | 4.20% | 41.46% | 10.08% | 93.28% |
| March 1999 | -29.19% | 2.61% | 40.76% | 72.51% | 491.94% |
| February 2001 | -34.76% | -21.16% | -19.47% | -35.74% | -12.53% |
| August 2001 | -32.47% | 3.03% | 14.91% | 36.12% | -21.46% |
| June 2026 (up to June 24) | -29.47% |
| Metric | 1M Return | 3M Return | 6M Return | 12M Return |
|---|---|---|---|---|
| Average | -8.79% | 7.48% | 21.67% | 112.71% |
| Median | 3.03% | 16.13% | 36.12% | 93.28% |
| Win Rate | 66.67% | 66.67% | 66.67% | 55.56% |
The near term was rarely comfortable.
In the month following a 25%-plus monthly crash, Oracle posted an average loss of 8.8%, the only horizon where the average return was negative.
But that figure is dragged down by one catastrophe in 1990, when the stock fell another 61% in the month after its signal. The median outcome was a modest 3% gain, and two-thirds of signals finished the first month higher.
The longer the horizon, the better the odds. Six months out, Oracle returned an average 21.7% and a median 36%, positive two-thirds of the time. A year later, the average ballooned to 113%, though the median, a cleaner read, settled at a still-powerful 93%.
The single strongest signal occurred in March 1999, when Oracle fell 29% in a month.
The stock barely moved over the next month, then took off: up 41% in three months, 73% in six and a staggering 492% over the following year, as dot-com mania swept it to its peak.
That peak did not last. The August 2001 signal, the last before this one, came as the same bubble unwound, and the stock was still down 21% a year later.
The 1990 episode was worse still. After a 27% monthly drop, Oracle kept falling, down 53% three months later and 47% six months later.
Buying an Oracle crash has, on occasion, meant catching a much larger one.
Photo: Shutterstock
Recent Comments