SoFi Technologies Inc (NASDAQ:SOFI) traded higher on Tuesday as traders continued to lean into the company’s crypto-adjacent narrative following its SoFiUSD stablecoin rollout, even as the broader tape was mixed.
- SoFi Technologies shares are climbing with conviction. Why are SOFI shares rallying?
What Is SoFiUSD and Its Impact on SOFI Stock?
SoFi recently rolled out SoFiUSD, which it describes as the first time a U.S. national bank‑issued stablecoin is available directly inside a banking app, with access expanded to nearly 15 million members. The token is positioned as a “bank‑grade,” 1:1 redeemable U.S. dollar stablecoin on a public blockchain, and members can buy, sell, hold and convert it directly in the SoFi app.
Financials led Tuesday’s sector leaderboard, which helps explain why SoFi is holding up even as the Nasdaq-100 is down 1.69% and the S&P 500 is down 0.55%. With 7 sectors advancing and an advance/decline ratio of 1.8, the day’s tone is more “rotation” than broad risk-off, and SoFi is landing on the right side of that rotation.
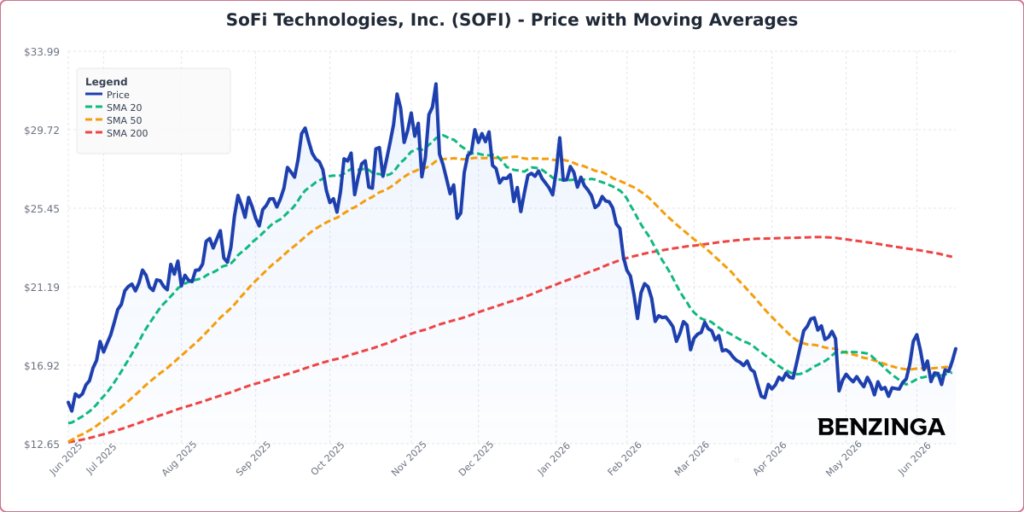
Critical Price Levels To Watch for SOFI Stock
At $17.96, the stock is trading above its 20-day SMA ($16.53) and 50-day SMA ($16.86), but it’s still trading below its 100-day SMA ($18.10) and well below its 200-day SMA ($22.81), which keeps the longer-term trend pressure in view. That “in-between” placement often produces choppy rallies that need quick follow-through to avoid rolling back over.

Momentum looks more like consolidation than a breakout: RSI is 54.39, a neutral reading that suggests buying pressure isn’t stretched and sellers aren’t in control either. In plain English, RSI helps gauge whether a move is getting overdone, and this level points to a market still deciding direction after the May swing low and April swing high.
The moving-average structure still carries baggage, with the 20-day SMA below the 50-day SMA (bearish) and the death cross from March (50-day SMA below the 200-day SMA) still acting as a longer-term headwind. From a “levels that matter” standpoint, bulls generally want to reclaim the 100-day area and then start compressing the gap to the 200-day to argue the downtrend is truly easing.
- Key Resistance: $19.00 — a nearby round-number area that lines up with an overhead supply zone as the stock works back toward its 100-day trend
- Key Support: $16.00 — a nearby round-number floor that sits close to the 20-day/50-day area where dip-buyers often try to defend trend
How SoFi Technologies Operates in Personal Finance
SoFi is a financial-services company founded in 2011 and based in San Francisco, and it’s built around being a one-stop shop for personal finance through a mobile app and website. What started with student loan refinancing has expanded into personal loans, credit cards, mortgages, investing, banking services, and financial planning.
That broader platform is why the SoFiUSD rollout matters to the stock: it’s another feature that can increase engagement inside the app and potentially widen SoFi’s product “surface area” with members.
SoFi Technologies Benzinga Edge Rankings Explained
Below is the Benzinga Edge scorecard for SoFi Technologies, highlighting its strengths and weaknesses compared to the broader market:
- Momentum: Weak (Score: 16.26) — The stock’s recent price action is lagging stronger-trending names, which can make breakouts harder to sustain.
- Growth: Strong (Score: 98.16) — The scorecard is flagging SoFi as growth-tilted, which can support the bull case if execution stays on track.
The Verdict: SoFi Technologies’s Benzinga Edge signal reveals a growth-heavy profile with weak momentum right now. For longer-term bulls, that often means the story can work, but the chart may still need proof (like reclaiming key moving averages) before trend-followers fully re-engage.
SOFI Stock Price Movement on Tuesday
SOFI Stock Price Activity: SoFi Technologies shares were up 4.00% at $17.81 at the time of publication on Tuesday, according to Benzinga Pro data.
Image: Shutterstock
Recent Comments