Amidst today’s fast-paced and highly competitive business environment, it is crucial for investors and industry enthusiasts to conduct comprehensive company evaluations. In this article, we will delve into an extensive industry comparison, evaluating Automatic Data Processing (NASDAQ:ADP) in comparison to its major competitors within the Professional Services industry. By analyzing critical financial metrics, market position, and growth potential, our objective is to provide valuable insights for investors and offer a deeper understanding of company’s performance in the industry.
Automatic Data Processing Background
Automatic Data Processing, or ADP, is a global, cloud-based human capital management provider offering payroll, compliance, talent management, benefits administration, and retirement services. The firm also provides HR outsourcing services, including PEO offerings, enabling clients to reduce HR overhead. Its broad suite serves customers of all sizes across diverse sectors, and the firm holds large market shares in its core markets. As of fiscal 2025, ADP counts over 1.1 million clients and manages payroll for more than 42 million workers across 140 countries.
| Company | P/E | P/B | P/S | ROE | EBITDA (in billions) | Gross Profit (in billions) | Revenue Growth |
|---|---|---|---|---|---|---|---|
| Automatic Data Processing Inc | 21.56 | 14.55 | 4.34 | 21.34% | $2.01 | $2.87 | 6.95% |
| Paychex Inc | 22.14 | 8.95 | 5.72 | 14.2% | $0.92 | $1.38 | 19.87% |
| Paycom Software Inc | 15.76 | 7.82 | 3.57 | 12.24% | $0.27 | $0.48 | 7.79% |
| Paylocity Holding Corp | 24.18 | 5.13 | 3.62 | 9.76% | $0.18 | $0.36 | 10.5% |
| Korn Ferry | 14.63 | 1.91 | 1.34 | 3.27% | $0.12 | $0.64 | 7.17% |
| Robert Half Inc | 23.62 | 2.55 | 0.58 | 1.1% | $0.06 | $0.48 | -3.83% |
| First Advantage Corp | 318.20 | 2.11 | 1.72 | 0.17% | $0.1 | $0.17 | 8.63% |
| Trinet Group Inc | 14.15 | 26.47 | 0.47 | 129.93% | $0.15 | $0.3 | -5.11% |
| Upwork Inc | 10.89 | 1.91 | 1.55 | 5.24% | $0.04 | $0.15 | 1.44% |
| Kforce Inc | 24.31 | 7.28 | 0.63 | 6.55% | $0.01 | $0.09 | 0.1% |
| Barrett Business Services Inc | 22.06 | 4.03 | 0.70 | -6.63% | $-0.0 | $0.04 | 4.94% |
| Fiverr International Ltd | 13.38 | 0.88 | 0.89 | 2.06% | $0.01 | $0.09 | -1.58% |
| Mastech Digital Inc | 33.42 | 0.84 | 0.41 | 0.29% | $0.0 | $0.01 | -14.97% |
| Average | 44.73 | 5.82 | 1.77 | 14.85% | $0.15 | $0.35 | 2.91% |
Upon a comprehensive analysis of Automatic Data Processing, the following trends can be discerned:
-
With a Price to Earnings ratio of 21.56, which is 0.48x less than the industry average, the stock shows potential for growth at a reasonable price, making it an interesting consideration for market participants.
-
The elevated Price to Book ratio of 14.55 relative to the industry average by 2.5x suggests company might be overvalued based on its book value.
-
With a relatively high Price to Sales ratio of 4.34, which is 2.45x the industry average, the stock might be considered overvalued based on sales performance.
-
With a Return on Equity (ROE) of 21.34% that is 6.49% above the industry average, it appears that the company exhibits efficient use of equity to generate profits.
-
With higher Earnings Before Interest, Taxes, Depreciation, and Amortization (EBITDA) of $2.01 Billion, which is 13.4x above the industry average, the company demonstrates stronger profitability and robust cash flow generation.
-
With higher gross profit of $2.87 Billion, which indicates 8.2x above the industry average, the company demonstrates stronger profitability and higher earnings from its core operations.
-
The company is experiencing remarkable revenue growth, with a rate of 6.95%, outperforming the industry average of 2.91%.
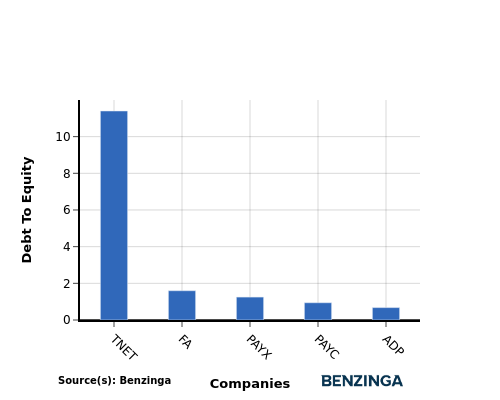
Debt To Equity Ratio

The debt-to-equity (D/E) ratio indicates the proportion of debt and equity used by a company to finance its assets and operations.
Considering the debt-to-equity ratio in industry comparisons allows for a concise evaluation of a company’s financial health and risk profile, aiding in informed decision-making.
In terms of the Debt-to-Equity ratio, Automatic Data Processing stands in comparison with its top 4 peers, leading to the following comparisons:
-
Automatic Data Processing demonstrates a stronger financial position compared to its top 4 peers in the sector.
-
With a lower debt-to-equity ratio of 0.68, the company relies less on debt financing and maintains a healthier balance between debt and equity, which can be viewed positively by investors.
Key Takeaways
The PE, PB, and PS ratios for Automatic Data Processing indicate that it may be undervalued compared to its peers in the Professional Services industry. However, its high ROE, EBITDA, gross profit, and revenue growth suggest strong financial performance relative to industry standards. This positions Automatic Data Processing as a potentially attractive investment opportunity within the sector.
This article was generated by Benzinga’s automated content engine and reviewed by an editor.
Recent Comments