ServiceNow Inc (NYSE:NOW) shares are trading lower on Tuesday as investors turn risk off and reassess the recent rebound in beaten-down enterprise software, with the Nasdaq-100 also sliding 2.05% and the S&P 500 down 1.13%. Here’s what investors need to know.
- ServiceNow stock is feeling bearish pressure. What’s weighing on NOW shares?
What Is Driving ServiceNow’s Recent Pullback?
The pullback is happening as traders focus on macro pressure points that tend to hit premium software multiples, higher energy prices and higher bond yields, despite a constructive longer-term AI narrative for enterprise platforms. The 10-year Treasury yield hit 4.55% Tuesday morning, and rising yields tends to compress valuations for high-multiple software.
ServiceNow had been a beneficiary of the “AI won’t kill software” rotation after Jensen Huang said on May 31 that the agentic-AI era is “one of the best moments in history to be a software company,” reinforcing the idea that platforms still run the workflows. That same setup can reverse quickly when the market de-risks, especially after a 16% month-long run like NOW just logged.
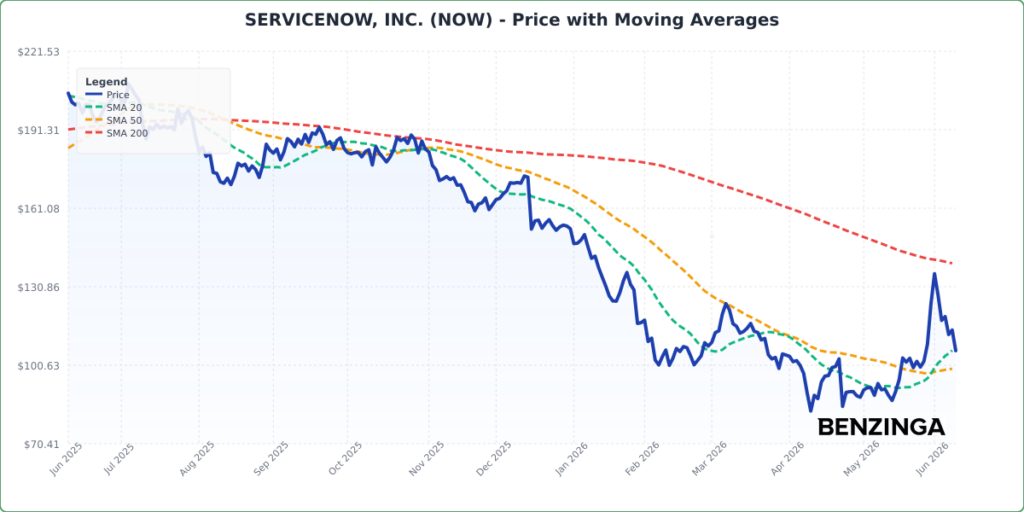
ServiceNow’s Critical Levels To Watch
From a longer-term trend view, ServiceNow is still in “repair mode”: it’s trading about 24% below its 200-day SMA ($139.86), and the death cross that formed in August 2025 remains an overhang for trend-followers. The stock is also down 48.15% over the past 12 months, which keeps rallies vulnerable to fast profit-taking when risk appetite fades.


Near-term structure is more constructive, but choppy: price is sitting right around the 20-day SMA ($106.30) and is about 7% above the 50-day SMA ($99.27), while it’s essentially flat-to-slightly below the 100-day SMA ($106.67). That mix often reads like a rebound trying to stabilize, but not yet strong enough to reclaim the intermediate trend.
Momentum is best framed through MACD right now: MACD is above its signal line and the histogram is positive, which points to improving upside pressure versus the prior downswing. In plain English, when MACD stays above the signal line, it suggests sellers are losing control and buyers are starting to dictate the next swing—even if the bigger trend hasn’t fully flipped.
- Key Resistance: $111.00 — a nearby round-number area that lines up with the 20-day EMA ($109.37) “overhead” zone where rebounds can stall
- Key Support: $85.50 — a nearby floor above the $81.24 52-week low area, where buyers previously showed up during the April swing low
ServiceNow Benzinga Edge Rankings Explained
Below is the Benzinga Edge scorecard for ServiceNow, highlighting its strengths and weaknesses compared to the broader market:
- Momentum: Weak (Score: 6.06) — The stock’s recent tape is lagging, which fits with the longer-term downtrend still in place.
- Quality: Neutral (Score: 48.58) — The profile looks more middle-of-the-pack on quality signals rather than a clear standout.
- Value: Weak (Score: 10.67) — The market is still paying up for the business, leaving the stock more sensitive to rate-driven multiple compression.
- Growth: Strong (Score: 88.44) — Growth expectations remain a key pillar of the bull case, even as the stock chops around technically.
The Verdict: ServiceNow’s Benzinga Edge signal reveals a growth-heavy profile with weak value and weak momentum, which can be a tough mix during risk-off sessions. For longer-term bulls, the setup often improves when momentum stabilizes above key moving averages while the market regains appetite for premium software multiples.
ServiceNow Stock Price Activity Today
NOW Stock Price Activity: ServiceNow shares were down 7.29% at $105.86 at the time of publication on Tuesday, according to Benzinga Pro data.
Image: Shutterstock
Recent Comments