The most important chart on Wall Street right now isn’t Nvidia Corp. (NASDAQ:NVDA) or Micron Technology Inc. (NASDAQ:MU). It’s the yield on the two-year Treasury note.
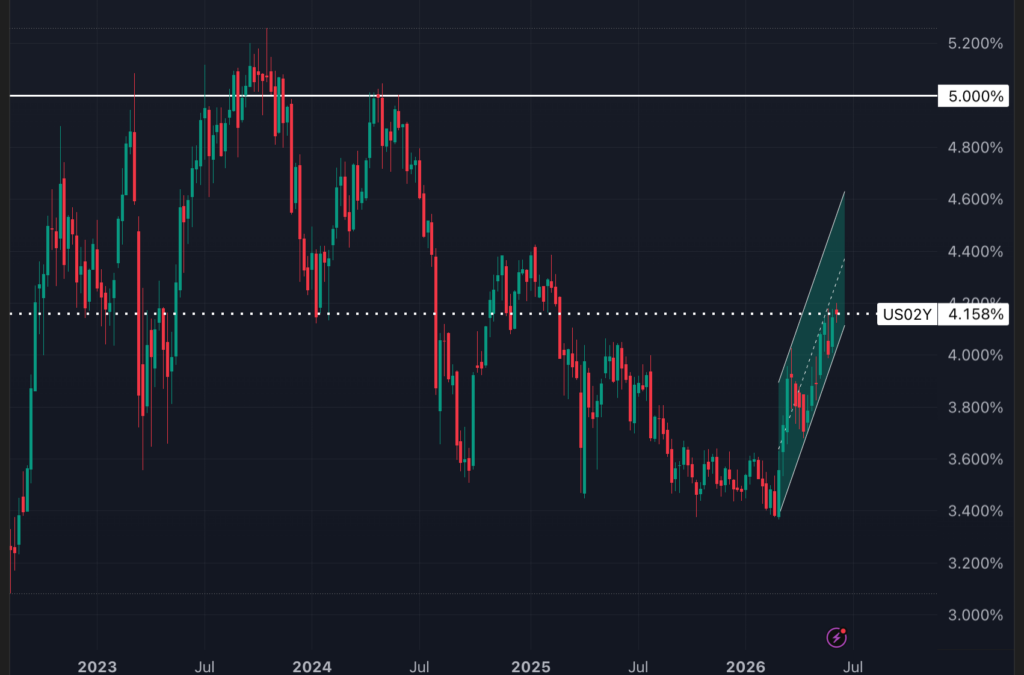
According to John Roque, technical analyst at 22V Research, the front end of the Treasury curve has become “Public Enemy No. 1” for risk assets after breaking above its March and May highs, setting up what he believes could be a move toward 5%.
Chart: 2-Year Treasury Yields Soared After Bottoming In March

Why Friday’s Chip Selloff Didn’t Come Out Of Nowhere
While last Friday’s sharp correction appeared sudden – the Nasdaq 100 dropped 4.8% while the iShares Semiconductor ETF (NYSE:SOXX) sunk over 10% – Roque indicates the warning signs had been flashing for weeks.
Many of the market’s biggest winners had reached historically extreme levels relative to their long term trends.
By early June, Sandisk Corp. (NASDAQ:SNDK) was trading nearly 250% above its 200 day moving average, Marvell Technology Inc. (NASDAQ:MRVL) more than 220% above, Micron over 200% above, and Dell Technologies Inc. (NASDAQ:DELL) roughly 195% above.
Rackspace Technology Inc. (NASDAQ:RXT) represented perhaps the most extreme example, surging almost 450% above its 200 day average in mid May.
The excesses extended well beyond individual stocks.
At last week’s peak, the Philadelphia Semiconductor Index stood 76% above its 200 day moving average, more than three standard deviations above normal based on data dating back to 1998.
South Korea’s KOSPI index – as closely tracked by the iShares South Korea ETF (NYSE:EWY) – was even more stretched, trading 83% above its long term trend, a move exceeding five standard deviations.
Those parabolic runs reminded Roque of an old observation from Bob Farrell, the former head of technical analysis at Merrill Lynch.
Rapidly rising markets usually run further than anyone expects, Farrell warned, but they “do not correct by going sideways.”
His conclusion is straightforward: the correction in many of these momentum names may not be over yet.
Higher Rates Are Pressuring More Than Just Chip Stocks
Roque’s concern extends beyond technology.
He remains bearish on gold and silver, arguing both metals remain far from oversold on weekly momentum measures and are still overbought on longer term monthly indicators.
He indicates that both assets experienced parabolic advances into their January 2026 peaks, with silver reaching roughly 160% above its 200 day moving average at its high.
In his view, rising interest rates have become the metals’ “kryptonite,” while investor enthusiasm remains uncomfortably elevated.
Bitcoin (CRYPTO: BTC) faces a similarly cautious outlook.
The cryptocurrency briefly slipped below Roque’s 60,000 downside target on Friday, and he still sees potential risk toward 40,000.
Unlike gold, silver or memory stocks, Roque does not believe Bitcoin experienced a true parabolic blowoff.
Instead, he argues the asset broke down in October 2025 and has failed to regain its footing since.
The Common Thread: Parabolas
The theme connecting Roque’s outlook is the danger of parabolic advances colliding with a rising-rate environment.
Gold and silver experienced their parabolic peaks in January. The AI-driven memory trade, he argues, followed with its own blowoff phase during May and June. Whether those highs ultimately mark the top will only become clear with hindsight.
For now, Roque believes investors should keep their eyes fixed on one market above all others.
As long as the two year Treasury yield continues marching toward 5%, “Public Enemy No. 1” may continue claiming victims across the market’s most crowded momentum trades.
Image: Shutterstock
Recent Comments