ServiceNow Inc (NYSE:NOW) shares are trading lower on Friday as the market turns risk-off and traders reassess the rebound that recently pulled money back into beaten-down enterprise names like ServiceNow. The pullback is happening during a broad sell-off, with the S&P 500 down 2.07% and the Nasdaq-100 leading the downside at a 3.9% loss.
Here’s what investors need to know.
- ServiceNow shares are sliding. Why is NOW stock falling?
What Is Driving ServiceNow’s Price Action?
The long-term case for ServiceNow recently received a significant validation from NVIDIA CEO Jensen Huang. Speaking at GTC Taipei, Huang stated that the emerging “agentic AI” era, where AI assistants can autonomously execute complex tasks, is actually one of the best moments in history to be a software company.
For retail investors, this addresses a major market fear: that AI will replace traditional software. Instead, the world’s leading AI chipmaker is signaling that advanced AI systems still need robust, established software platforms like ServiceNow to act as the operating system and actually carry out those automated workflows.
Why Rising Oil And Bond Yields Are Pressuring Tech
Despite the positive AI narrative, ServiceNow is facing broader economic headwinds that typically hurt high-flying tech stocks. West Texas Intermediate (WTI) crude oil jumped 7.5% to around $93.95 per barrel on Friday, while the 10-year Treasury yield climbed to 4.51%.
When energy prices and bond yields rise, it signals to Wall Street that inflation might stick around. This combination tends to compress stock multiples, which means institutional investors become less willing to pay premium prices for expensive software companies.
Furthermore, this economic pressure has kept the market-implied odds of a Federal Reserve interest rate hike in December above 60%, creating a cautious environment across the broader technology sector.
Critical Price Levels To Watch For NOW
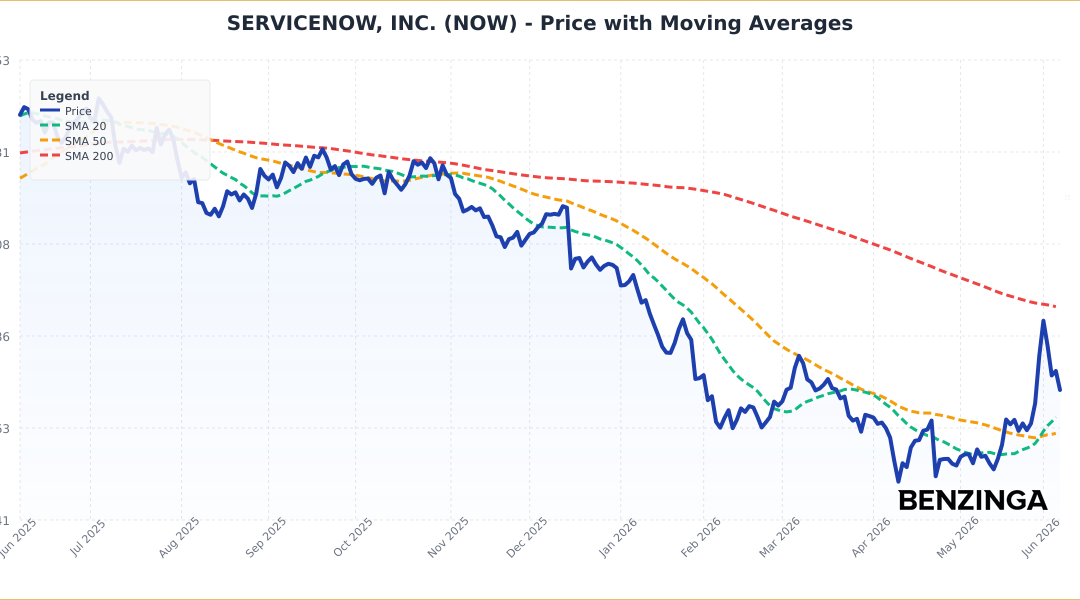
From a trend standpoint, ServiceNow is still in “repair mode” longer-term: it’s trading 19.6% below its 200-day SMA ($140.50), and the death cross that formed in August 2025 (50-day below 200-day) remains an overhang. The near-term picture is better, with price 8.4% above the 20-day SMA ($104.21) and 14.3% above the 50-day SMA ($98.87), which is consistent with a rebound that’s been strong enough to lift shorter averages.


Momentum is best framed through MACD right now: MACD is above its signal line and the histogram is positive, which points to improving upside pressure versus the prior downswing. In plain English, when MACD is above the signal line, it often means sellers are losing control and buyers are starting to dictate the next swing, even if the bigger trend hasn’t fully flipped.
- Key Resistance: $126.50 — a nearby pivot zone where rebounds can stall, especially with the stock still below longer-term trend gauges
- Key Support: $98.00 — a prior demand area that also sits near the 50-day SMA neighborhood ($98.87), making it a key “line in the sand” on pullbacks
How ServiceNow Operates In The Software Market
ServiceNow Inc provides software solutions to structure and automate various business processes via a SaaS delivery model, with a primary focus on the IT function for enterprise customers. It started in IT service management, expanded within IT workflows and has pushed workflow automation into customer service, HR service delivery and security operations.
That positioning matters for the current AI debate because the bull case is less “AI replaces software” and more “AI still needs governed systems and workflow pipes to move work securely across an enterprise.” In that framing, ServiceNow is being treated as a platform layer that agentic AI can run through, not a tool that gets bypassed.
ServiceNow’s Benzinga Edge Scorecard Analysis
Below is the Benzinga Edge scorecard for ServiceNow, highlighting its strengths and weaknesses compared to the broader market:
- Momentum: Weak (Score: 7.26) — The longer-window trend profile is still lagging even after the recent rebound.
- Quality: Neutral (Score: 48.4) — The fundamentals screen as middle-of-the-pack versus the broader market.
- Value: Weak (Score: 10.67) — The stock screens expensive on value factors, which can amplify drawdowns on risk-off days.
- Growth: Strong (Score: 88.44) — Growth is the main pillar, helping explain why buyers have been willing to pay a premium multiple.
The Verdict: ServiceNow’s Benzinga Edge signal reveals a growth-led setup with weak value and weak momentum, which can work in a steady uptrend but tends to be choppy when the market turns defensive. For longer-term bulls, the key is whether the stock can keep building above the $98 area and eventually reclaim the 200-day trend zone near $140.
ServiceNow Stock Price Movement On Friday
NOW Stock Price Activity: ServiceNow shares were down 6.07% at $112.11 at the time of publication on Friday, according to Benzinga Pro data.
Image: Shutterstock
Recent Comments