
JPMorgan (NYSE:JPM) analysts say simultaneous outflows from Bitcoin (CRYPTO: BTC) and gold ETFs over the past two weeks signal the debasement trade is cooling, not a rotation from Bitcoin into gold.
Iran-US Peace Hopes Pulling Money Out Of Both Assets
The debasement trade refers to buying Bitcoin and gold as hedges against geopolitical instability, currency weakness, and inflation.
JPMorgan managing director Nikolaos Panigirtzoglou wrote in a report that the outflows appear linked to growing hopes for an Iran-US deal rather than any shift in preference between the two assets.
Bitcoin ETFs saw larger outflows than gold ETFs over the two-week period, which JPMorgan says reflects Bitcoin’s role as one of the primary expressions of the debasement trade since the Iran conflict began.
The same cooling trend appeared in futures markets, where institutional investors reduced exposure to both assets simultaneously.
JPMorgan’s momentum signal framework also flagged weakening positioning from commodity trading advisors—trend-following institutional traders—in both Bitcoin and gold over the past one to two weeks, reinforcing the broader pullback narrative.
IBIT Posted Second-Largest Daily Outflow On Record Wednesday
Until earlier this month, Bitcoin was outperforming gold within the debasement trade, with Bitcoin ETFs attracting inflows while gold ETFs struggled to recover earlier losses.
That dynamic has now flipped. BlackRock’s IBIT (NASDAQ:IBIT) shed $527.8 million on Wednesday alone—its second-largest single-day outflow since launch—while all 11 US spot Bitcoin ETFs combined lost $733.4 million, their largest daily outflow since January 29.
Chart Confirms Breakdown With Death Cross Still Intact

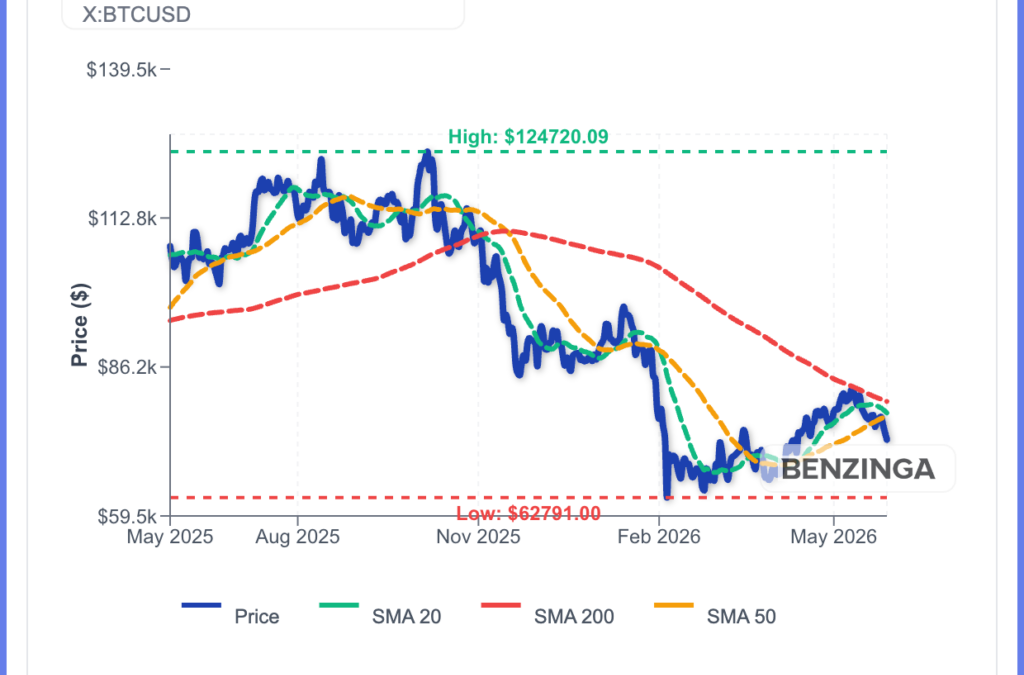
Bitcoin is fully breaking down from the rising channel that formed off February’s $62,000 lows.
The moving average picture remains bearish at the macro level. The 50-day SMA at $77,161 sits below the 200-day SMA at $79,974, keeping the death cross from November 2025 active.
Meanwhile, MACD sits below its signal line with a negative histogram, confirming that upside momentum is fading rather than building.
Both the 20-day EMA at $76,890 and 50-day EMA at $76,475 remain below the 200-day EMA at $81,271.
For bulls, reclaiming and holding above the 200-day zone is the key step that shifts the conversation from bounce to trend. The 12-month performance sits down 32.50%, meaning rallies are still happening inside a broader drawdown.
Image: Shutterstock
Recent Comments