
Ford Motor Co (NYSE:F) shares are trading higher Wednesday morning as traders continue to lean into optimism around the company’s Europe product roadmap and its new energy-storage push.
- Ford Motor stock is challenging resistance. What’s behind F new highs?
What’s Ford’s Plan For Europe And Energy Storage?
CEO Jim Farley recently outlined a plan to launch seven new vehicles for Europe between now and 2029, including the Ranger Super Duty, an all-electric Transit City van, and five passenger vehicles such as an electric hatch and a small electric SUV. The roadmap also includes a new multi-energy Bronco and two multi-energy rally-bred crossover models.
Ford also launched Ford Energy, a wholly owned subsidiary focused on advanced energy storage systems, with plans to anchor operations at its Kentucky facility and target 20 gigawatt-hours of annual manufacturing capacity. Wall Street has pointed to the grid-scale opportunity, with Morgan Stanley suggesting the energy-storage unit could ultimately be worth $10 billion on a standalone basis.
Ford Stock: Key Technical Levels To Watch
Today’s bid is happening in a mixed tape—Dow Jones is up 0.5%, but the Nasdaq is down 0.4%—and Ford is acting more like a “risk-on” discretionary leader than a market follower. With the stock up 54.3% over the past year and now above its prior 52-week high of $15.54, the chart is in breakout territory, but it’s also getting stretched.
Price is trading well above the major moving-average stack: about 23.7% above the 20-day SMA ($12.86), 28.7% above the 50-day SMA ($12.37), and 25.4% above the 200-day SMA ($12.69). That supports a buy-the-dip mindset, but it also raises the odds that any momentum fade turns into a sharper mean-reversion move back toward the $13–$13.25 area.
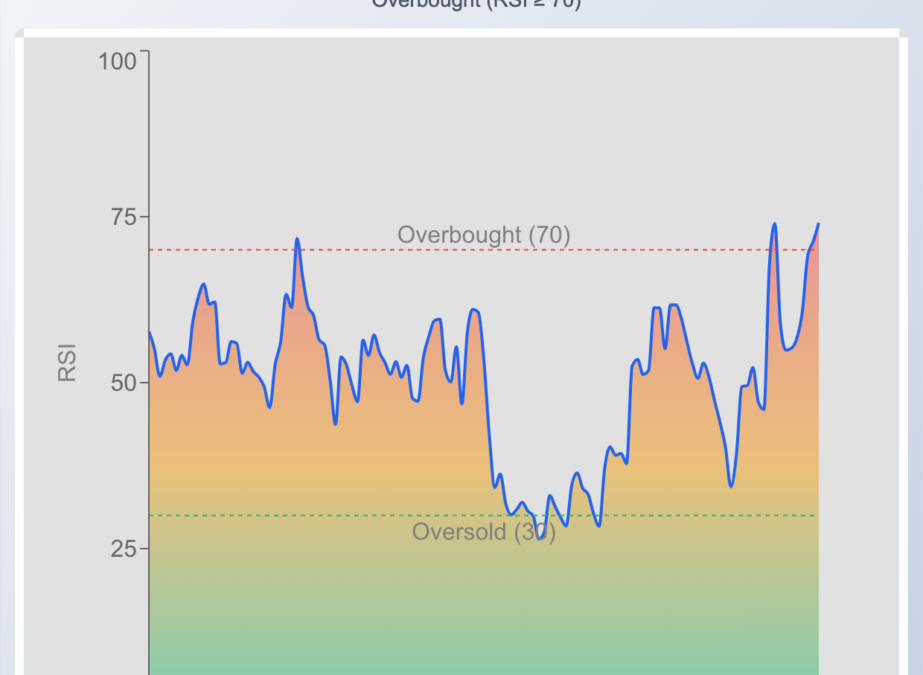
Momentum is best framed by RSI, which is at 71.71—overbought—and that lines up with the stock pressing new highs after a strong run from the March swing low. RSI is a quick gauge of how “stretched” a move is, and readings above 70 often mean upside can continue, but pullbacks become more likely if buyers stop chasing.
The trend picture is still a bit mixed under the hood: the 20-day SMA is above the 50-day SMA (bullish), but the 50-day SMA remains below the 200-day SMA after the death cross in April, which can signal the longer-term trend is still repairing. If Ford can hold above the prior breakout zone and keep the shorter averages rising, it helps bulls argue this is a durable uptrend rather than a late-stage spike.
- Key Support: $13.00 — a nearby round-number area where buyers previously stepped in and a logical first “line in the sand” if price mean-reverts toward the moving-average cluster

Ford Stock Price Movement On Wednesday
F Stock Price Activity: Ford Motor shares were up 4.24% at $15.98 at the time of publication on Wednesday, according to Benzinga Pro data.
Image: Shutterstock
Recent Comments