SCHMID Group NV (NASDAQ:SHMD) shares are sliding on Monday. The stock seems to be getting caught in broader market pressure, with the Nasdaq down 0.32% and the S&P 500 off 0.46%.
- Schmid Group shares are sliding. Why is SHMD stock falling?
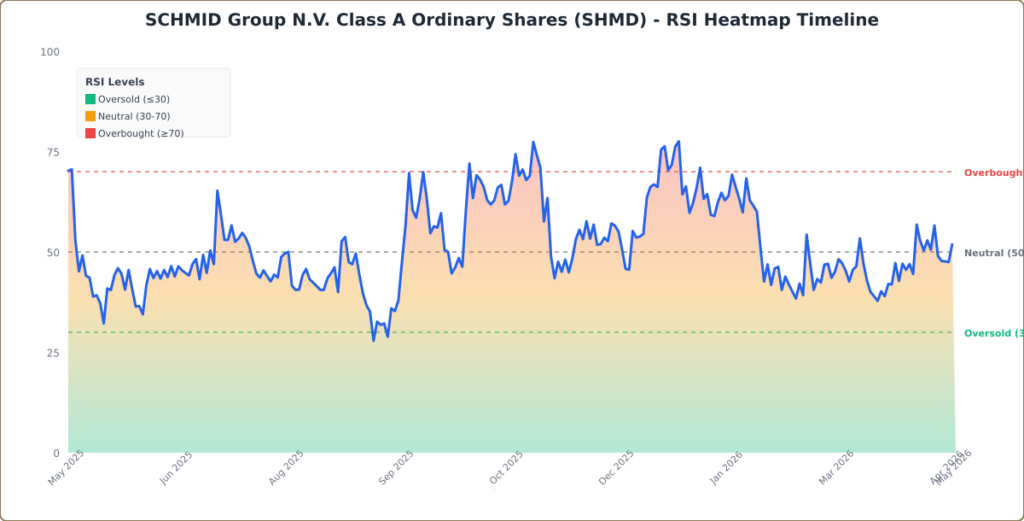
What The Chart Is Signaling
The stock is pulling back after failing to hold recent levels, and the technical setup leans bearish in the short term. Schmid sits in the middle of its 52‑week range ($2.00 to $10.65), reflecting indecision about the longer‑term trend, but the near‑term picture has weakened.
SHMD is now trading 5.1% below its 20‑day simple moving average and 17.1% below its 100‑day SMA, a combination that signals fading momentum and a tougher intermediate trend. However, the stock remains 11.6% above its 200‑day SMA, meaning the longer‑term structure hasn’t broken down yet.

Momentum indicators show mixed signals. The RSI sits in neutral territory, not oversold, which means sellers still have room to push the stock lower without triggering a reflexive bounce. Meanwhile, the MACD line remains above the signal line with a positive histogram, a sign that downside momentum may be slowing even as price pulls back.
Key Levels Traders Are Watching
- Resistance: $6.00 — near the 20‑day SMA, where recent rebound attempts have stalled
- Support: $5.50 — a short‑term floor where buyers have stepped in previously
A break below $5.50 would open the door to a deeper retracement, while reclaiming the 20‑day SMA would be the first sign that momentum is stabilizing.
Macro Pressure
The Russell 2000 down 0.56% and the advance/decline ratio at 0.2, and traders are seemingly using weakness to reduce exposure rather than buy dips. Only two sectors are green, and industrial‑tech names like Schmid tend to underperform on defensive days.
SHMD Shares Are Falling
SHMD Price Action: Schmid shares were down 11.30% at $5.65 at the time of publication on Monday, according to Benzinga Pro.
Image: Vinnikava Viktoryia/Shutterstock.com
Recent Comments