In today’s rapidly changing and fiercely competitive business landscape, it is vital for investors and industry enthusiasts to carefully evaluate companies. In this article, we will perform a comprehensive industry comparison, evaluating Advanced Micro Devices (NASDAQ:AMD) against its key competitors in the Semiconductors & Semiconductor Equipment industry. By analyzing important financial metrics, market position, and growth prospects, we aim to provide valuable insights for investors and shed light on company’s performance within the industry.
Advanced Micro Devices Background
Advanced Micro Devices designs a variety of digital semiconductors for markets such as PCs, gaming consoles, data centers (including artificial intelligence), industrial, and automotive applications. AMD’s traditional strength was in central processing units and graphics processing units used in PCs and data centers. However, AMD is emerging as a prominent player in AI GPUs and related hardware. Additionally, the firm supplies the chips found in prominent game consoles such as the Sony PlayStation and Microsoft Xbox.
| Company | P/E | P/B | P/S | ROE | EBITDA (in billions) | Gross Profit (in billions) | Revenue Growth |
|---|---|---|---|---|---|---|---|
| Advanced Micro Devices Inc | 129.16 | 8.72 | 15.92 | 2.44% | $2.86 | $5.58 | 34.11% |
| NVIDIA Corp | 42.70 | 32.33 | 23.75 | 31.11% | $51.28 | $51.09 | 73.21% |
| Broadcom Inc | 79.04 | 24.03 | 28.89 | 9.12% | $11.15 | $13.16 | 29.47% |
| Micron Technology Inc | 24.47 | 8.07 | 10.11 | 21.0% | $18.48 | $17.75 | 196.29% |
| Texas Instruments Inc | 46.02 | 14.60 | 13.32 | 9.35% | $2.42 | $2.8 | 18.58% |
| Analog Devices Inc | 71.17 | 5.63 | 16.39 | 2.46% | $1.52 | $2.04 | 30.42% |
| Qualcomm Inc | 16.77 | 6.10 | 3.80 | 13.57% | $4.11 | $6.68 | 5.0% |
| Marvell Technology Inc | 51 | 9.57 | 16.62 | 2.79% | $0.75 | $1.15 | 22.08% |
| Monolithic Power Systems Inc | 118.73 | 21.24 | 26.43 | 4.95% | $0.21 | $0.41 | 20.83% |
| NXP Semiconductors NV | 27.65 | 6.68 | 5.82 | 10.69% | $1.7 | $1.79 | 12.2% |
| ON Semiconductor Corp | 340.90 | 5.07 | 6.79 | 2.33% | $0.45 | $0.55 | -11.17% |
| GLOBALFOUNDRIES Inc | 39.46 | 2.89 | 5.16 | 1.68% | $0.73 | $0.51 | 0.0% |
| Astera Labs Inc | 161.35 | 24.73 | 41.46 | 3.41% | $0.07 | $0.2 | 91.77% |
| Credo Technology Group Holding Ltd | 96.58 | 17.54 | 30.56 | 10.03% | $0.16 | $0.28 | 201.49% |
| Tower Semiconductor Ltd | 102.67 | 7.70 | 14.45 | 2.78% | $0.2 | $0.12 | 13.69% |
| First Solar Inc | 13.41 | 2.15 | 3.93 | 5.62% | $0.7 | $0.67 | 11.15% |
| MACOM Technology Solutions Holdings Inc | 122 | 14.95 | 19.80 | 3.64% | $0.07 | $0.15 | 24.52% |
| Lattice Semiconductor Corp | 5783.50 | 22.17 | 30.56 | -1.08% | $0.01 | $0.1 | 24.16% |
| Average | 419.85 | 13.26 | 17.52 | 7.85% | $5.53 | $5.85 | 44.92% |
Upon a comprehensive analysis of Advanced Micro Devices, the following trends can be discerned:
-
With a Price to Earnings ratio of 129.16, which is 0.31x less than the industry average, the stock shows potential for growth at a reasonable price, making it an interesting consideration for market participants.
-
With a Price to Book ratio of 8.72, significantly falling below the industry average by 0.66x, it suggests undervaluation and the possibility of untapped growth prospects.
-
Based on its sales performance, the stock could be deemed undervalued with a Price to Sales ratio of 15.92, which is 0.91x the industry average.
-
The company has a lower Return on Equity (ROE) of 2.44%, which is 5.41% below the industry average. This indicates potential inefficiency in utilizing equity to generate profits, which could be attributed to various factors.
-
Compared to its industry, the company has lower Earnings Before Interest, Taxes, Depreciation, and Amortization (EBITDA) of $2.86 Billion, which is 0.52x below the industry average, potentially indicating lower profitability or financial challenges.
-
The gross profit of $5.58 Billion is 0.95x below that of its industry, suggesting potential lower revenue after accounting for production costs.
-
The company is witnessing a substantial decline in revenue growth, with a rate of 34.11% compared to the industry average of 44.92%, which indicates a challenging sales environment.
Debt To Equity Ratio

The debt-to-equity (D/E) ratio gauges the extent to which a company has financed its operations through debt relative to equity.
Considering the debt-to-equity ratio in industry comparisons allows for a concise evaluation of a company’s financial health and risk profile, aiding in informed decision-making.
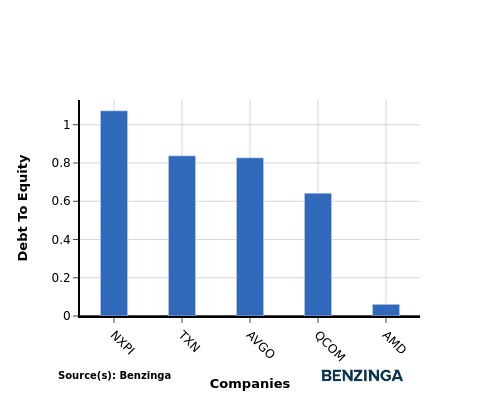
When assessing Advanced Micro Devices against its top 4 peers using the Debt-to-Equity ratio, the following comparisons can be made:
-
Among its top 4 peers, Advanced Micro Devices has a stronger financial position with a lower debt-to-equity ratio of 0.06.
-
This indicates that the company relies less on debt financing and maintains a more favorable balance between debt and equity, which can be viewed positively by investors.
Key Takeaways
For Advanced Micro Devices, the PE, PB, and PS ratios are all low compared to industry peers, indicating potential undervaluation. However, the low ROE, EBITDA, gross profit, and revenue growth suggest weaker financial performance relative to competitors in the Semiconductors & Semiconductor Equipment sector.
This article was generated by Benzinga’s automated content engine and reviewed by an editor.
Recent Comments