Ford Motor Co (NYSE:F) is nearing a technical breakdown, with its short-term moving averages on the verge of slipping below long-term levels — a classic Death Cross setup.
But unlike isolated technical signals, this one is being reinforced by a steady drumbeat of fundamental pressure.
• What should traders watch with F?

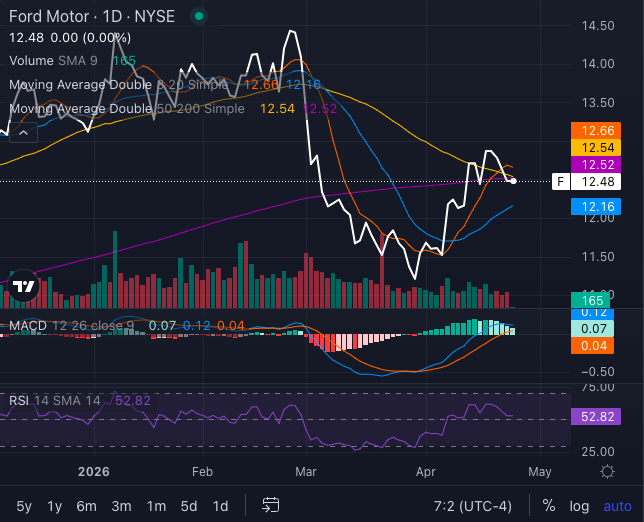
Chart created using Benzinga Pro
Ford Stock Death Cross Setup Signals Weak Momentum
Ford’s stock is now trading below key moving averages, with the shorter-term trend rolling over into longer-term resistance. A confirmed death cross — where the 50-day moving average falls below the 200-day — would mark a shift toward a sustained downtrend.
Momentum indicators are already flashing caution. The MACD (moving average convergence divergence) indicator is flattening after a brief recovery, while the RSI (relative strength index) sits in neutral territory, lacking the strength typically seen in bullish reversals.
In short, the chart isn’t breaking down sharply — but it isn’t showing strength either.
EV Reset and Demand Weakness Add Pressure
The technical weakness comes as Ford continues to navigate a difficult transition in its electric vehicle strategy. The company has taken significant write-downs tied to its EV pivot, including a broader $19.5 billion strategic reset as it scales back aggressive electrification plans.
Recent data also points to slowing demand. Ford’s first quarter deliveries fell 9% year-over-year, with EV sales plunging sharply, underscoring a mismatch between supply and consumer demand.
Even management has acknowledged the shift, pivoting toward hybrids and more affordable vehicles as high-priced EV demand cools.
F Chart Reflects A Broader Transition

Ford’s stock now sits roughly 14% below its recent highs, struggling to regain upward momentum even as broader markets stabilize.
The setup suggests a stock caught between restructuring hopes and near-term execution challenges. If the death cross confirms, it could reinforce the idea that Ford’s turnaround will take longer than expected.
For now, the chart isn’t signaling panic — but it is signaling hesitation. And in markets, that often comes before the next decisive move.
Image via Shutterstock
Recent Comments