Figma Inc (NYSE:FIG) shares are trading lower on Thursday, extending its recent downtrend and showing notable underperformance relative to the broader market. The Nasdaq is down 0.43% and the S&P 500 is off 0.31%.
- Figma stock is among today’s weakest performers. Why are FIG shares down?
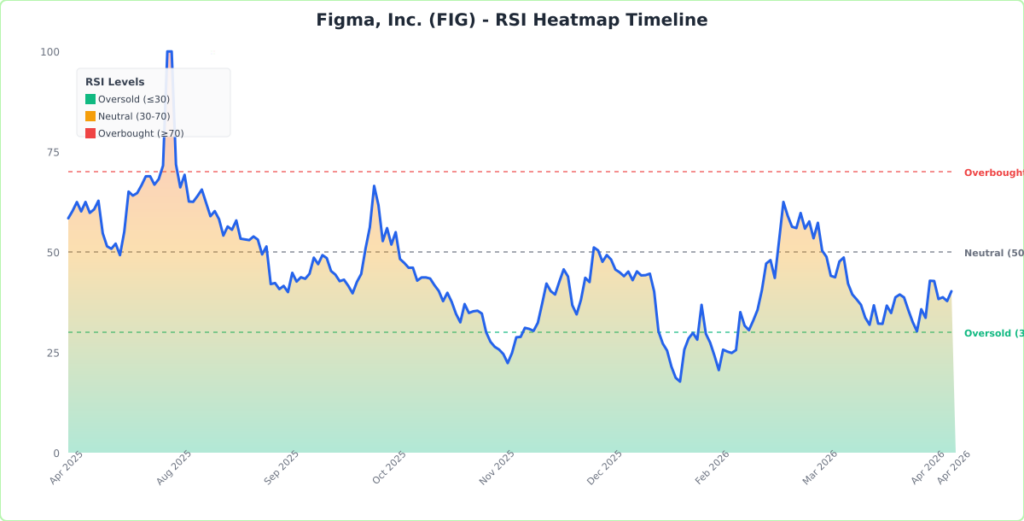
What the Chart Is Signaling
FIG remains stuck near the bottom of its 52‑week range, and the chart continues to show a clear downward trend. The stock is trading 14.3% below its 20‑day simple moving average, which reflects strong short‑term selling pressure, and 40.2% below its 100‑day SMA, confirming that the intermediate trend is still firmly bearish.
The longer‑term picture also leans negative. The 20‑day sits below the 50‑day, and the 50‑day remains below the 200‑day following January’s death cross. Until Figma can reclaim these moving averages, rallies are likely to be viewed as counter‑trend.
Momentum indicators are mixed. MACD has crossed above its signal line, which can indicate that downside momentum is slowing, but RSI remains in the low‑40s, showing continued weakness without reaching oversold territory.

Volume trends have been skewed toward selling. Down days have been accompanied by heavier volume, while buying volume has been lighter, suggesting that sellers remain in control and buyers are not yet stepping in with conviction.
Key Levels Traders Are Watching
- Resistance: $20.50 This level aligns with the 20‑day EMA and has capped recent rebound attempts. A move above $20.50 with improving volume would be the first sign of stabilization.
- Support: $17.50 This area sits near the recent 52‑week low. If Figma breaks below $17.50, traders will look toward the mid‑$16 range as the next potential support zone.
FIG Shares Are Dipping
FIG Price Action: Figma shares were down 10.59% at $17.14 at the time of publication on Thursday. The stock is trading at a new 52-week low, according to Benzinga Pro.
Image: Shutterstock
Recent Comments