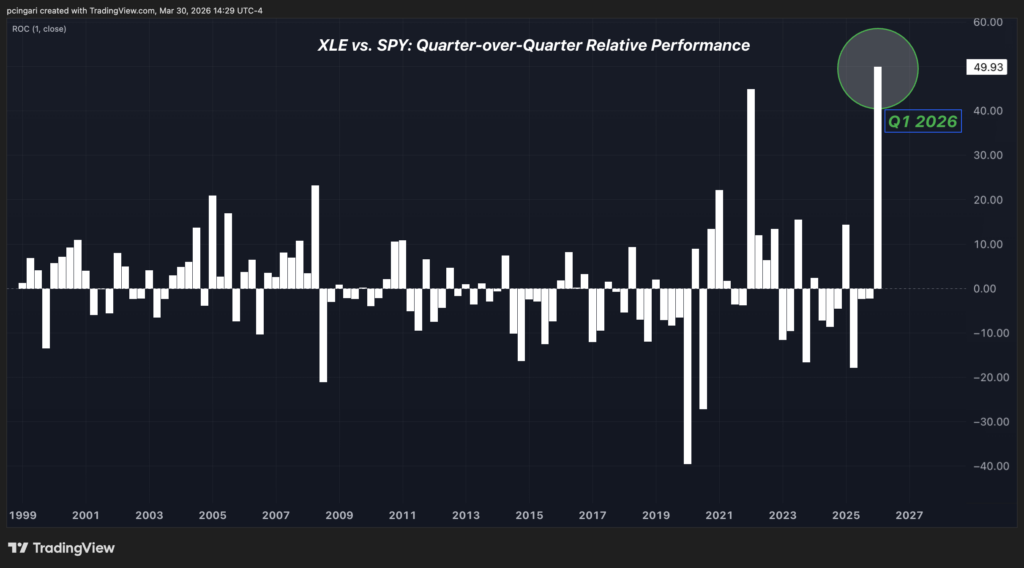
Energy stocks are on track to post their best quarterly outperformance against the S&P 500 on record — including the rally post-Ukraine oil shock of 2022.
The Energy Select Sector SPDR Fund (NYSE:XLE) has surged over 40% year-to-date while the S&P 500, tracked by the SPDR S&P 500 ETF Trust (NYSE:SPY), sits down roughly 6%.
Yet, despite this historic performance gap, Goldman Sachs analysts say the sector still doesn’t fully price in the structural shift underway.

Energy Numbers Define Historic Quarter
The Energy (XLE ETF) is up 11.4% in March alone — its third straight month of gains — capping its best quarter against the broader market.
Notably, 14 of 22 XLE constituents have rallied more than 10% in March alone.
APA Corporation (NASDAQ:APA) leads the pack with a 44.23% monthly gain.
Occidental Petroleum Corporation (NYSE:OXY) follows at +25.48%, alongside Marathon Petroleum Corporation (NYSE:MPC) at +25.24%. Valero Energy Corporation (NYSE:VLO) added 23.21% and EOG Resources Inc. (NYSE:EOG) climbed 21.05%.
Yet, despite the strong rally most energy names still trade at a meaningful discount to the broader market.
Best Performing Energy Stocks in March 2026
| XLE Constituent | MTD Return | P/E (NTM) |
|---|---|---|
| APA Corporation | +44.23% | 11.2x |
| Occidental Petroleum Corporation | +25.48% | 19.5x |
| Marathon Petroleum Corporation | +25.24% | 13.1x |
| Valero Energy Corporation | +23.21% | 15.0x |
| EOG Resources, Inc. (NYSE:EOG) | +21.05% | 12.7x |
| Phillips 66 (NYSE:PSX) | +20.86% | 13.8x |
| Devon Energy Corporation (NYSE:DVN) | +18.99% | 11.7x |
| Coterra Energy Inc. (NYSE:CTRA) | +18.21% | 13.7x |
| ConocoPhillips (NYSE:COP) | +17.21% | 20.7x |
| Diamondback Energy, Inc. (NASDAQ:FANG) | +14.29% | 14.5x |
| Chevron Corporation (NYSE:CVX) | +13.76% | 23.5x |
| Exxon Mobil Corporation (NYSE:XOM) | +13.60% | 20.3x |
| ONEOK, Inc. (NYSE:OKE) | +13.27% | 16.7x |
| Halliburton Company (NYSE:HAL) | +10.45% | 17.8x |
Oil & Gas Stocks Still Trading As If Oil Is $71: Goldman Sachs
The catalyst of the recent leg of energy outperformance is the Strait of Hormuz.
The ongoing Iran conflict has disrupted an estimated 13.1 million barrels per day in net oil flows — before any meaningful supply and demand response.
Both WTI and Brent front-month crude futures have surged past $100 a barrel, but the rally in energy equities has been more disciplined: stocks are not pricing in $80 or $90 oil.
They’re pricing in something more conservative.
According to Goldman Sachs analysts, oil exploration and production companies are currently discounting a WTI price of approximately $71 per barrel — well below the elevated front-month price — because equity investors are anchoring to the longer-dated oil forward curve rather than reacting to the spot spike.
That conservatism is why the valuation case remains intact even after a 40% rally.
“Despite the significant increase in the front-month oil price, oily E&P equities have modestly increased since the start of the Iran conflict — the equities are discounting a longer-dated view of the oil forward curve.”— Neil Mehta, head of Energy, Utilities & Mining Research at Goldman Sachs said in a recent note.
With Brent crude trading around $108/barrel, the implied gap is enormous.
The roughly $37 difference between what oil and gas equities are pricing in and front-month crude futures either signals a continuing buying opportunity on energy — or the market’s starkest message that the war may end sooner than expected.
Goldman’s Two Scenarios: Base Case And The 2008 Record
Goldman’s base case is orderly. Hormuz flows gradually recover, OECD strategic petroleum reserve releases absorb part of the supply shock, and Brent crude moderates back toward the $70s by year-end.
At that price, E&P equities — already discounting only $71 WTI — remain well-supported, with limited downside and a credible path to mid-cycle re-rating.
The tail risk is something else entirely. Goldman’s Daan Struyven, the firm’s head of oil research, calculates that if Hormuz flows stay suppressed for 60-plus days and Middle East production falls 2 million barrels per day for an extended period, Brent crude could surge $42 per barrel above current levels through end of 2027 — breaching the $147.50 intraday record set during the 2008 financial crisis.
The latter scenario would also mean the current gap between what E&P equities are discounting and where spot oil is trading represents one of the most dramatic mispricings in the history of energy markets.
Image: Shutterstock
Recent Comments