Gold is being hit from two directions simultaneously — and the combination is producing a sell-off not seen in over four decades.
• SPDR Gold Shares stock is showing weakness. Why is GLD stock trading lower?
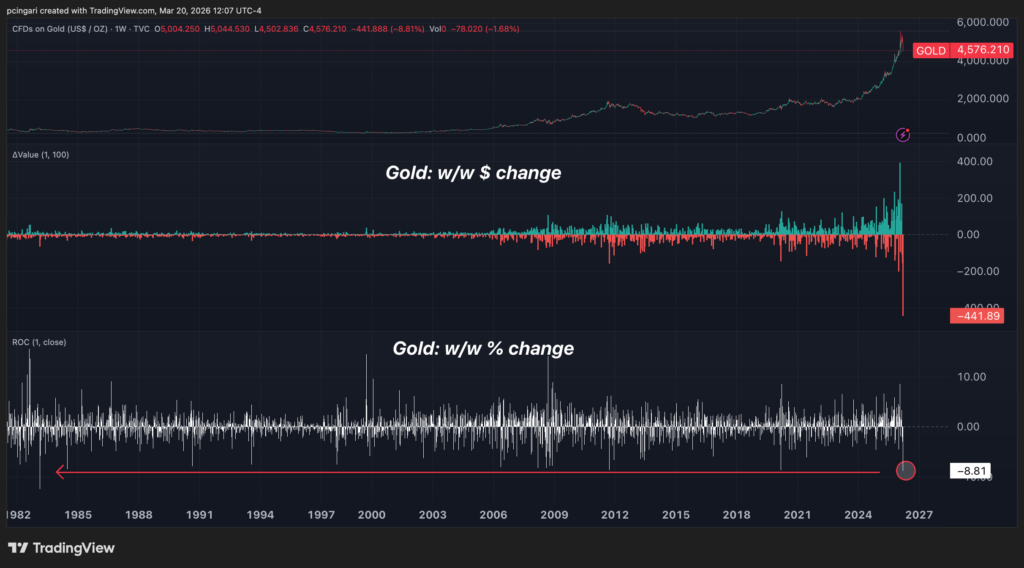
The precious metal is down nearly 9% week-to-date through Friday morning — its worst weekly performance in over four decades.
While rising expectations for Fed rate hikes have been the primary driver, another pressure point is emerging: growing speculation that some Gulf states may be forced to sell gold reserves to plug fiscal gaps as crude export revenues evaporate.
The chart tells two stories simultaneously. The percentage decline of 9.11% is the worst weekly move since 1983.
But the dollar loss is even more striking — gold has shed $441 per ounce this week, the largest weekly dollar decline in the metal’s recorded history, a direct consequence of prices that were near all-time highs when the selling began.

The Rate Hike That Broke Gold’s Most Powerful Tailwind
Gold’s most powerful tailwind entering 2026 was the expectation of falling real interest rates. Two to three Federal Reserve rate cuts were priced for the year.
Lower real rates reduce the opportunity cost of holding gold — a non-yielding asset — and that dynamic had driven bullion to record highs in 2025.
The Iran war destroyed that thesis in three weeks.
The CME FedWatch tool now shows a 52% probability of a Fed rate hike by October. Polymarket prices the odds of a 2026 hike at 24%, up from just 6% before the conflict began.
When rate hike expectations surge, real yields climb, the dollar strengthens, and gold — the world’s most prominent zero-yield safe haven — faces a double headwind.
The GLD Exodus: Institutions Are Voting With Their Feet
The price decline is being amplified by a historic institutional exit from gold ETFs. The SPDR Gold Shares ETF (NYSE:GLD) — the world’s largest gold fund — has seen $6.3 billion in outflows month-to-date, the worst monthly redemption in the ETF’s recorded history.
In the single week of March 5, $4.2 billion left the fund — also the largest weekly outflow ever recorded for GLD, stripping the ETF of 25 tonnes of physical gold backing in seven days.

But There May Be A Second Force: Gulf States Hemorrhaging Revenue
The rate-hike story is the consensus explanation. But financial markets may be beginning to price in something darker — and more structural.
The Iran war has created a grotesque paradox for Gulf oil producers. Brent crude is up 49% this month, pricing in the scarcity of supply. But the oil cannot physically leave.
The Strait of Hormuz — through which the vast majority of Gulf crude exports must pass — is effectively closed to commercial shipping.
The price spike that would normally fill sovereign coffers is instead stranded behind a military chokepoint.
Together, Gulf Cooperation Council states are estimated to be losing roughly $1.2 billion per day in stranded export revenues — a total of more than $15 billion since the war began.
Iran’s attacks on Qatar’s Ras Laffan Industrial City have knocked out 17% of the country’s LNG export capacity for an estimated three to five years, with $20 billion in annual revenues at risk, QatarEnergy’s CEO told Reuters.
Goldman Sachs projects Qatar and Kuwait could each lose 14% of GDP if hostilities extend through April.
Could Gold Suffer Forced Liquidation By Gulf States?
The speculation about Gulf sovereign gold sales was ignited Thursday by Spencer Hakimian, founder of Tolou Capital Management, who wrote on social media that gold was collapsing as “Arab Gulf states sell their assets to raise money.”
The post circulated widely, with gold falling 6.78% in the hours that followed.
The rumour has not been confirmed.
Yet its underlying fiscal logic — $1.2 billion per day in lost revenues, no export route in sight, sovereign spending commitments that cannot easily be suspended — creates a backdrop in which gold reserve liquidation is no longer implausible.
It does not need to be confirmed to be priced.
Photo: Shutterstock
Recent Comments