
While crude oil prices soar above triple digits amid the ongoing disruption to shipping through the Strait of Hormuz, President Donald Trump‘s next political crisis may already be taking shape at the diesel pump — and a 20-year chart is spelling out exactly why.
The Scariest Chart For The US Economy Right Now
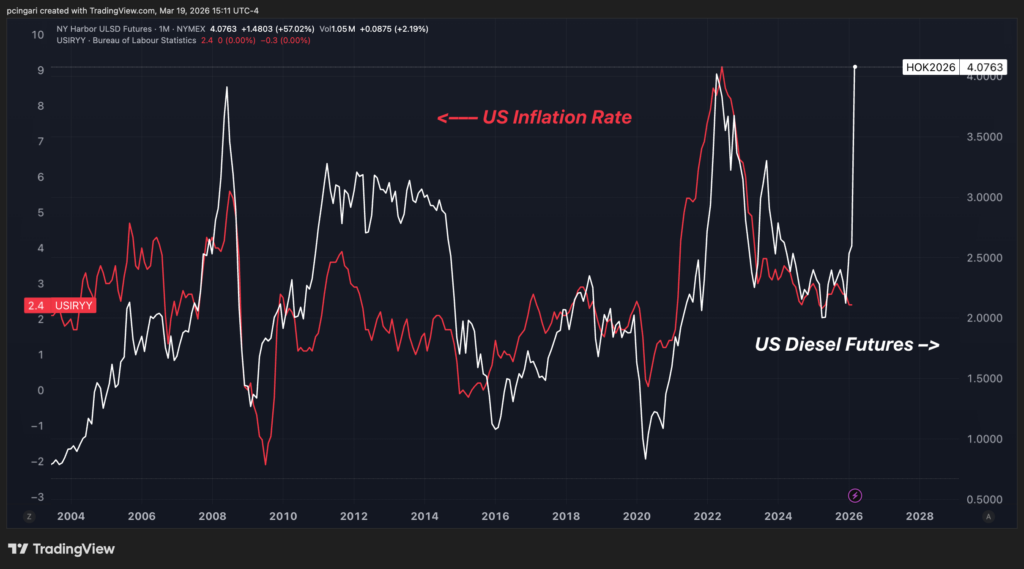
The chart below overlays US Diesel Futures — the wholesale benchmark traded on NYMEX — against the US annual inflation rate across two decades.
The correlation is unmistakable: every major diesel spike — 2008, 2011, 2022 — was followed by a meaningful surge in the Consumer Price Index inflation.
The current move in diesel is larger than all of them.
NY Harbor Ultra-Low Sulfur Diesel futures have surged to $4.0752 a gallon — up nearly 57% month-to-date.
That is the biggest single-month spike in diesel futures on record.
At the pump, the shift is already being felt. The national average for retail diesel tracked by AAA stands at $5.099 today, up from $3.677 just a month ago — a 39% jump in 30 days.
At current diesel price levels, the historical relationship between fuel prices and consumer inflation implies an annual CPI reading north of 8%.
That would represent a more than tripling of the current 2.4% reading.
Why Diesel Matters For Inflation
Most Americans think of diesel as a trucker’s fuel. It is far more than that.
Roughly 70% of all goods sold in the United States move by truck at some point in their journey. Trucks run on diesel. When diesel prices surge, every freight invoice in the country gets repriced — and those costs work their way into groceries, manufactured goods, construction materials, and farm inputs within weeks.
When diesel prices surge, the cost increase does not stay at the pump — it bleeds into every product on every shelf.
A 57% spike in diesel effectively functions as a tax on the entire supply chain.
Trucking companies pass costs to distributors. Distributors pass them to retailers. Retailers pass them to consumers.
The transmission chain is fast and wide.
Diesel powers the tractors that plant and harvest food. It heats warehouses and millions of Northeastern homes via heating oil — a near-identical distillate.
It fuels backup generators that keep factories and data centers running.
There is almost no physical good in the American economy that does not carry embedded diesel cost in its final price.
The lag between a diesel price surge and its appearance in the Consumer Price Index runs roughly six to ten weeks.
It is short enough that the April 10 CPI report will almost certainly begin to show it.
March 2026 US CPI Odds Soar
Betting markets are already pricing in a significant jump in inflation at the next release in April.
According to Polymarket, the most likely outcome for the March U.S. annual inflation reading — due April 10 — is above 3.4%, with a 53% probability.
A move from February’s 2.4% to a potential 3.4% in March would represent a full 1 percentage point increase in the annual inflation rate in a single month — a jump that has occurred only a handful of times in postwar U.S. history.
The Iran war’s diesel shock may be about to make it seven.
| Episode | 1-Month Jump In Annual CPI | Trigger |
|---|---|---|
| August 1973 | +1.7 ppt | Arab oil embargo |
| July 1981 | +1.2 ppt | Second oil shock aftermath |
| September 2005 | +1.1 ppt | Hurricane Katrina energy disruption |
| October 2009 | +1.1 ppt | Post-financial crisis base effect |
| November 2009 | +2.0 ppt | Base effect continuation |
| April 2021 | +1.6 ppt | Post-COVID reopening surge |
Why This Is Trump’s Problem
For the White House, a painful political irony is taking shape. Trump has spent months publicly pressuring the Federal Reserve to cut interest rates, framing lower borrowing costs as both economic stimulus and political validation.
A diesel-driven inflation shock threatens to make that argument not just wrong, but politically radioactive.
Consumer sentiment tracks fuel prices more closely than any other single economic indicator. Americans do not read the CPI report.
They read the pump display.
With the 2026 midterm elections in November, a sustained spell above $5 at the retail diesel pump — flowing into grocery prices, delivery fees, and heating costs within two months — would constitute a significant political headwind at precisely the wrong time in the electoral calendar.
Meanwhile, the Fed is caught between two forces pulling in opposite directions: a slowing economy that would normally call for easier policy, and an energy shock that could reignite inflation to levels that would require the opposite.
Zero rate cuts is now the single most likely outcome for 2026 at 34% — a probability that stood at roughly 9% before the conflict began.
That is a near-fourfold swing in the market’s assessment of Fed policy over a matter of days.
The most revealing shift is not in the base case but in the tail. The probability of a Fed rate hike in 2026 has doubled to 18% since the conflict began — from a baseline of roughly 8%.
It is not the consensus. But it is no longer absurd.
When markets start pricing in rate hikes, the ghost of 2022 resurfaces. That year, the S&P 500 — as tracked by the SPDR S&P 500 ETF Trust (NYSE:SPY) — tumbled 19.4% as the Fed’s aggressive tightening cycle crushed equity valuations across every sector.
Rate cuts were the political prize Trump has been angling for since taking office.
A Hormuz-sparked oil and fuel shock turning into an inflation spiral — and forcing the Fed’s hand toward hikes — is the nightmare scenario he cannot afford, least of all with the midterms nine months away.
Image: Shutterstock
Recent Comments