Dogecoin (CRYPTO: DOGE) and Shiba Inu (CRYPTO: SHIB) are trading flat, with both meme coins compressed in symmetrical triangles signaling imminent 10-15% moves in either direction.
Dogecoin’s Coiled Spring

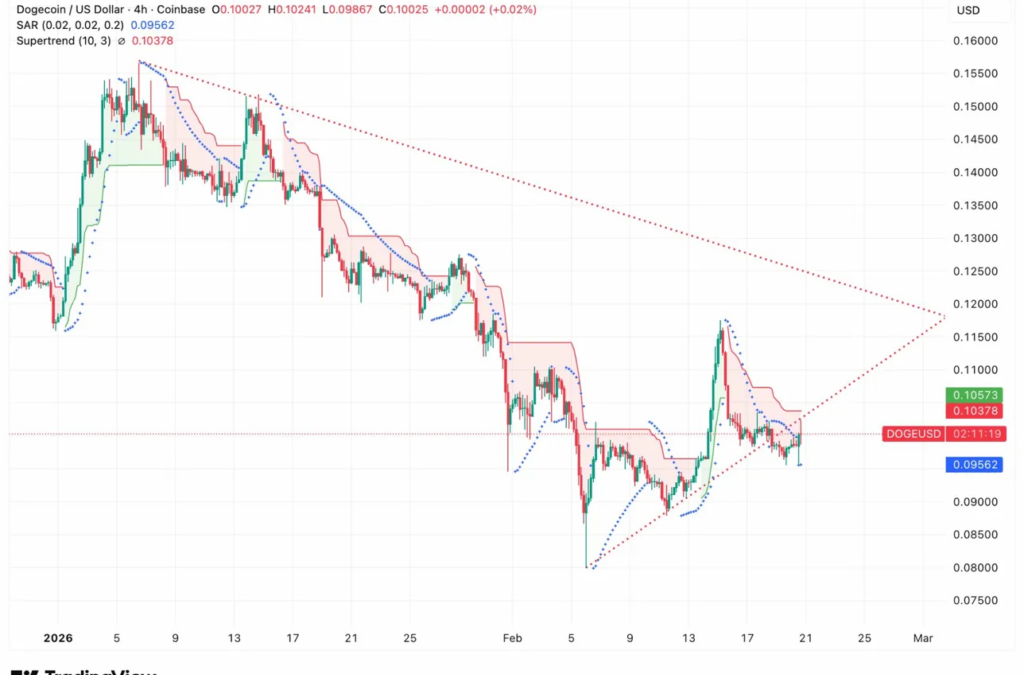
DOGE’s Parabolic SAR flipped below price at $0.09562—the first constructive signal in weeks suggesting the $0.083 capitulation low may have marked bottom.
However, the Supertrend at $0.10378 remains bearish, sandwiching DOGE between conflicting indicators.
An ascending trendline from $0.083 provides support while a descending trendline from January highs caps rallies around $0.115-$0.12, creating a wedge compressing price between $0.095-$0.105.
Derivatives data shows building conviction. Open interest jumped 2.30% to $1.08 billion while volume surged 16.66% to $2.10 billion—the kind of surge that precedes explosive moves.
Long/short ratios show heavy bullish positioning: Binance at 2.6483, OKX at 3.54. This creates liquidation fuel if DOGE breaks down but also short-squeeze potential if it breaks higher.
Critical levels: Breaking above the Supertrend at $0.1038 opens $0.105-$0.107, then $0.11-$0.115. Breaking below $0.095 triggers liquidation cascades toward $0.090-$0.093 or retesting $0.083.
Shiba Inu’s Triangle Compression

SHIB grinds sideways with all EMAs tightly clustered: 20 EMA at $0.00000635, 50 EMA at $0.00000638, 100 EMA at $0.00000648, and 200 EMA at $0.00000683.
This compression after months of decline signals downtrend exhaustion before the next directional move.
A symmetrical triangle is forming between an ascending support from the $0.00000515 capitulation low and descending resistance, with the apex at $0.00000640-$0.00000650.
Breakouts from these patterns typically deliver 10-15% moves.
Token burns surged 1,900% in 24 hours with 1 million SHIB burned. Recent large burns include multiple 1 million SHIB transactions and a massive 2.4 million burn five days ago.
This reduces circulating supply and provides fundamental support, though 585.47 trillion SHIB still circulates.
The Supertrend at $0.00000653 sits just overhead in bearish mode.
Breaking above flips momentum bullish and targets $0.0000068-$0.000007 where the 200 EMA resides.
Breaking below $0.00000625 invalidates the triangle and triggers selling toward $0.000006 or $0.0000055-$0.0000057.
Image: Shutterstock
Recent Comments