In the dynamic and fiercely competitive business environment, conducting a thorough analysis of companies is crucial for investors and industry enthusiasts. In this article, we will perform an extensive industry comparison, evaluating Palantir Technologies (NASDAQ:PLTR) in relation to its major competitors in the Software industry. By closely examining crucial financial metrics, market position, and growth prospects, we aim to offer valuable insights for investors and shed light on company’s performance within the industry.
Palantir Technologies Background
Palantir is an artificial intelligence, analytics, and automated decision-making company that leverages data to drive efficiency across its clients’ organizations. The firm serves commercial and government clients via its Foundry and Gotham platforms, respectively. Palantir works only with entities in Western-allied nations and reserves the right not to work with anyone that is antithetical to Western values. The company was founded in 2003 and went public in 2020.
| Company | P/E | P/B | P/S | ROE | EBITDA (in billions) | Gross Profit (in billions) | Revenue Growth |
|---|---|---|---|---|---|---|---|
| Palantir Technologies Inc | 206.37 | 41.95 | 74.52 | 8.71% | $0.4 | $0.97 | 19.11% |
| Salesforce Inc | 25.36 | 2.97 | 4.54 | 3.44% | $3.3 | $8.0 | 8.63% |
| AppLovin Corp | 44.25 | 86.04 | 20.44 | 63.27% | $1.11 | $1.23 | 68.23% |
| Intuit Inc | 29.87 | 6.26 | 6.32 | 2.29% | $0.83 | $3.0 | 18.34% |
| Adobe Inc | 16.13 | 9.51 | 4.84 | 15.87% | $2.51 | $5.54 | 10.49% |
| Synopsys Inc | 50.86 | 2.77 | 9.64 | 1.6% | $1.16 | $1.6 | 37.83% |
| Cadence Design Systems Inc | 69.62 | 14.14 | 14.18 | 5.63% | $0.48 | $1.16 | 10.15% |
| Autodesk Inc | 46.23 | 17.45 | 7.45 | 12.23% | $0.53 | $1.69 | 18.03% |
| Workday Inc | 66.99 | 4.70 | 4.64 | 2.79% | $0.45 | $1.84 | 12.59% |
| Datadog Inc | 344.29 | 10.88 | 12.03 | 1.02% | $0.05 | $0.71 | 28.35% |
| Roper Technologies Inc | 24.72 | 1.88 | 4.81 | 2.15% | $0.82 | $1.4 | 2.04% |
| Zoom Communications Inc | 17.33 | 2.84 | 5.76 | 6.72% | $0.34 | $0.96 | 4.44% |
| PTC Inc | 22.67 | 4.76 | 6.49 | 4.34% | $0.48 | $0.78 | -23.27% |
| Trimble Inc | 43.83 | 2.63 | 4.33 | 1.94% | $0.2 | $0.62 | 2.9% |
| Tyler Technologies Inc | 47.41 | 4.07 | 6.50 | 2.33% | $0.15 | $0.28 | 9.67% |
| IREN Ltd | 22.87 | 4.54 | 15.39 | 16.39% | $0.67 | $0.15 | 355.41% |
| Guidewire Software Inc | 118.86 | 6.99 | 8.52 | 2.09% | $0.03 | $0.21 | 26.53% |
| Average | 61.96 | 11.4 | 8.49 | 9.01% | $0.82 | $1.82 | 36.9% |
By carefully studying Palantir Technologies, we can deduce the following trends:
-
The Price to Earnings ratio of 206.37 for this company is 3.33x above the industry average, indicating a premium valuation associated with the stock.
-
It could be trading at a premium in relation to its book value, as indicated by its Price to Book ratio of 41.95 which exceeds the industry average by 3.68x.
-
With a relatively high Price to Sales ratio of 74.52, which is 8.78x the industry average, the stock might be considered overvalued based on sales performance.
-
The company has a lower Return on Equity (ROE) of 8.71%, which is 0.3% below the industry average. This indicates potential inefficiency in utilizing equity to generate profits, which could be attributed to various factors.
-
The Earnings Before Interest, Taxes, Depreciation, and Amortization (EBITDA) of $400 Million is 0.49x below the industry average, suggesting potential lower profitability or financial challenges.
-
The gross profit of $970 Million is 0.53x below that of its industry, suggesting potential lower revenue after accounting for production costs.
-
With a revenue growth of 19.11%, which is much lower than the industry average of 36.9%, the company is experiencing a notable slowdown in sales expansion.
Debt To Equity Ratio

The debt-to-equity (D/E) ratio gauges the extent to which a company has financed its operations through debt relative to equity.
Considering the debt-to-equity ratio in industry comparisons allows for a concise evaluation of a company’s financial health and risk profile, aiding in informed decision-making.
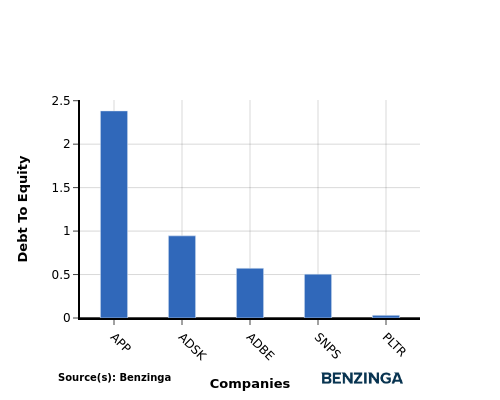
When assessing Palantir Technologies against its top 4 peers using the Debt-to-Equity ratio, the following comparisons can be made:
-
When considering the debt-to-equity ratio, Palantir Technologies exhibits a stronger financial position compared to its top 4 peers.
-
This indicates that the company has a favorable balance between debt and equity, with a lower debt-to-equity ratio of 0.03, which can be perceived as a positive aspect by investors.
Key Takeaways
The high PE, PB, and PS ratios of Palantir Technologies suggest that the company is trading at a premium compared to its peers in the Software industry. However, the low ROE, EBITDA, gross profit, and revenue growth indicate that the company may be facing challenges in generating profits and growth relative to its industry counterparts.
This article was generated by Benzinga’s automated content engine and reviewed by an editor.
Recent Comments