
In today’s fast-paced and highly competitive business world, it is crucial for investors and industry followers to conduct comprehensive company evaluations. In this article, we will delve into an extensive industry comparison, evaluating Verizon Communications (NYSE:VZ) in relation to its major competitors in the Diversified Telecommunication Services industry. By closely examining key financial metrics, market standing, and growth prospects, our objective is to provide valuable insights and highlight company’s performance in the industry.
Verizon Communications Background
Wireless services account for 75% of Verizon Communications’ total service revenue and nearly all of its operating income. The firm serves about 94 million postpaid and 20 million prepaid phone customers via its nationwide network, making it the largest US wireless carrier. Fixed-line telecom operations include local networks in the Northeast that reach about 30 million homes and businesses, including about 20 million served by the Fios fiber-optic network. Verizon closed its acquisition of Frontier Communications in January, adding networks that reach another 15 million locations, including 9 million with fiber. These networks serve about 11 million broadband customers. Verizon also provides telecom services nationwide to enterprise customers, using a mix of its own and other networks.
| Company | P/E | P/B | P/S | ROE | EBITDA (in billions) | Gross Profit (in billions) | Revenue Growth |
|---|---|---|---|---|---|---|---|
| Verizon Communications Inc | 10.99 | 1.80 | 1.37 | 2.24% | $12.81 | $20.48 | 7.57% |
| AT&T Inc | 8.65 | 1.67 | 1.50 | 3.39% | $17.67 | $18.89 | 8.98% |
| Comcast Corp | 5.49 | 1.11 | 0.89 | 2.24% | $9.62 | $22.54 | 3.56% |
| BCE Inc | 5.29 | 1.72 | 1.33 | 26.67% | $6.82 | $4.28 | 1.31% |
| TELUS Corp | 24.09 | 1.84 | 1.40 | 3.17% | $2.0 | $3.12 | 0.5% |
| IDT Corp | 15.24 | 3.84 | 1 | 7.15% | $0.04 | $0.12 | 4.26% |
| Average | 11.75 | 2.04 | 1.22 | 8.52% | $7.23 | $9.79 | 3.72% |
By carefully studying Verizon Communications, we can deduce the following trends:
-
With a Price to Earnings ratio of 10.99, which is 0.94x less than the industry average, the stock shows potential for growth at a reasonable price, making it an interesting consideration for market participants.
-
Considering a Price to Book ratio of 1.8, which is well below the industry average by 0.88x, the stock may be undervalued based on its book value compared to its peers.
-
The Price to Sales ratio of 1.37, which is 1.12x the industry average, suggests the stock could potentially be overvalued in relation to its sales performance compared to its peers.
-
With a Return on Equity (ROE) of 2.24% that is 6.28% below the industry average, it appears that the company exhibits potential inefficiency in utilizing equity to generate profits.
-
Compared to its industry, the company has higher Earnings Before Interest, Taxes, Depreciation, and Amortization (EBITDA) of $12.81 Billion, which is 1.77x above the industry average, indicating stronger profitability and robust cash flow generation.
-
Compared to its industry, the company has higher gross profit of $20.48 Billion, which indicates 2.09x above the industry average, indicating stronger profitability and higher earnings from its core operations.
-
The company’s revenue growth of 7.57% is notably higher compared to the industry average of 3.72%, showcasing exceptional sales performance and strong demand for its products or services.
Debt To Equity Ratio

The debt-to-equity (D/E) ratio is an important measure to assess the financial structure and risk profile of a company.
Considering the debt-to-equity ratio in industry comparisons allows for a concise evaluation of a company’s financial health and risk profile, aiding in informed decision-making.
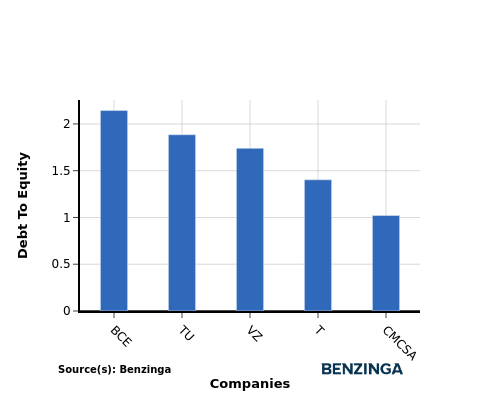
When assessing Verizon Communications against its top 4 peers using the Debt-to-Equity ratio, the following comparisons can be made:
-
As Verizon Communications is in the middle of the list in terms of the debt-to-equity ratio, it suggests that the company has a moderate debt-to-equity ratio of 1.74 compared to the other companies.
-
This position indicates a relatively balanced financial structure, where the company maintains a reasonable level of debt while also leveraging equity for financing its operations.
Key Takeaways
For Verizon Communications, the PE ratio is low compared to peers, indicating potential undervaluation. The PB ratio is also low, suggesting a possible bargain opportunity. However, the high PS ratio may indicate overvaluation based on revenue. In terms of ROE, Verizon Communications shows lower profitability compared to peers. The high EBITDA and gross profit suggest strong operational performance, while the high revenue growth indicates potential for future expansion.
This article was generated by Benzinga’s automated content engine and reviewed by an editor.
Recent Comments