
Bitcoin (CRYPTO: BTC) ETF holders are now underwater with the average purchase price at $90,200 while BTC trades at $84,000, according to Bianco Research’s Jim Bianco.
The Profitless Reality
Bianco broke down the numbers across three posts on X, pointing out the average Bitcoin ETF buyer since January 2024 is down roughly $5,000, or about 7% underwater.
Strategy (NASDAQ:MSTR), the largest digital asset treasury, holds Bitcoin at an average purchase price of $76,020. The company sits on roughly $8,000 profit per coin, or about 12% gain.
Together, Strategy and the Bitcoin ETFs control roughly 10% of all Bitcoin in circulation.
However, Bianco’s data shows they now have no unrealized profits collectively.
The $84,500 Defense Line
Historical patterns suggest the average cost basis acts as critical support.
In September 2024, when BTC fell below the ETF’s average purchase level, the token consolidated before staging a strong recovery.
A similar pattern emerged in early 2025 during the tariff-driven selloff.
Bianco Research calculates the combined average purchase price for Strategy and spot BTC ETFs currently sits at $84,500.
Throughout this cycle, major drawdowns have consistently eased at this level, making it crucial to maintaining the broader bullish market structure.
A sustained dip below $84,500 signals a deeper drawdown that could invalidate the bullish thesis entirely.
Technical Breakdown Confirms Weakness
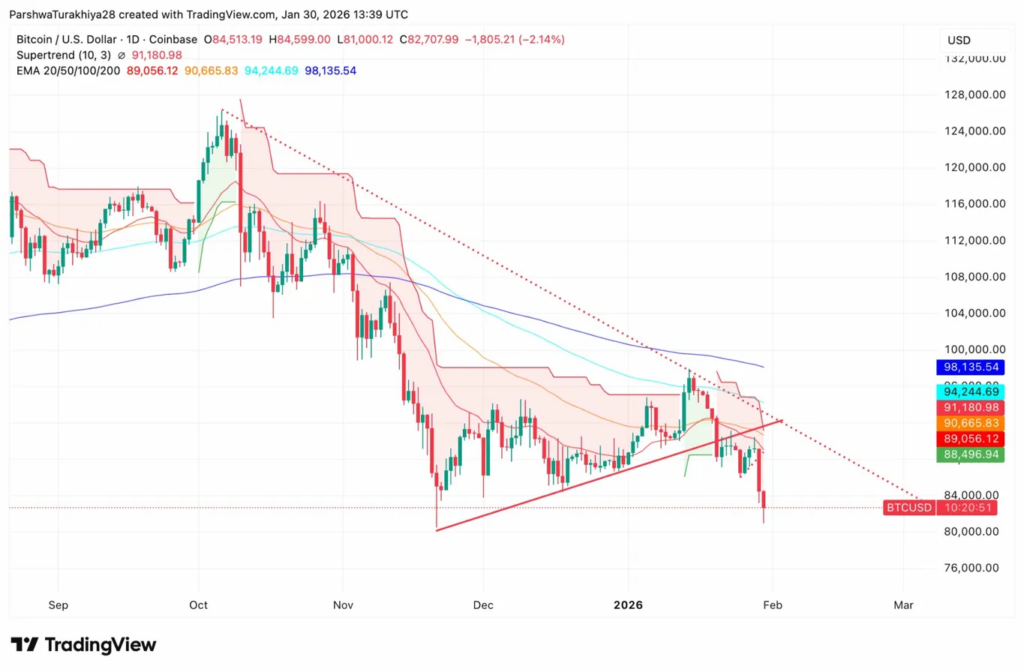
Bitcoin is down 2.5% on the day and nearly 8% from recent highs, with the technical setup showing critical weakness.
BTC broke below a rising wedge pattern formed by converging trendlines.
The wedge compressed price action for several weeks, and the breakdown is a classic bearish signal that typically leads to further downside.
Bitcoin trades below all four key EMAs in bearish formation: 20 EMA at $89,056, 50 EMA at $90,665, 100 EMA at $94,244, and 200 EMA at $98,135.
The 20 EMA sits nearly $5,000 above current price, showing the extent of the momentum shift.
The Supertrend indicator at $91,180 flipped bearish and positions well above price, confirming the downtrend.
Support Levels And Downside Targets
Immediate support sits around $82,500-$83,000, representing the measured target from the wedge breakdown.
Below that, major support sits at $80,000, a psychologically important level that acted as support in previous corrections.
A break below $80,000 triggers panic selling and opens the door to the $75,000-$78,000 range.
For any bullish recovery, Bitcoin needs to reclaim the wedge breakdown level around $87,000-$88,000 and push back above the 20 EMA.
Until that happens, rallies represent opportunities to reduce risk rather than add exposure.
Image: Shutterstock
Recent Comments