
Bitcoin (CRYPTO: BTC) is struggling around $90,000 support as Bloomberg Intelligence strategist Mike McGlone warns BTC could revisit $50,000 in 2026 if equity market volatility picks up.
McGlone Links Bitcoin Risk To Gold’s Historic Surge
McGlone’s thesis centers on an unusual pattern: gold rallied faster in 2025 than any year since 1979, yet stock market volatility stayed extremely low during that same period. Historically, these conditions don’t last.
When gold surges while volatility remains suppressed, it typically signals that turbulence is coming.
McGlone argues that if volatility returns to equity markets in 2026, Bitcoin will get hit alongside stocks because it trades like a risk asset.
The strategist identifies $50,000 as Bitcoin’s “enduring pivot”—a long-term support level that has held through previous cycles.
Avoiding a drop to that level requires stock market volatility to stay buried, which McGlone views as increasingly unlikely given gold’s behavior.
His core argument: Bitcoin moves with equities when markets get choppy. If stocks sell off due to rising volatility, Bitcoin follows. Gold’s 2025 performance suggests that volatility spike is coming in 2026.
Technical Breakdown Confirms Weakness
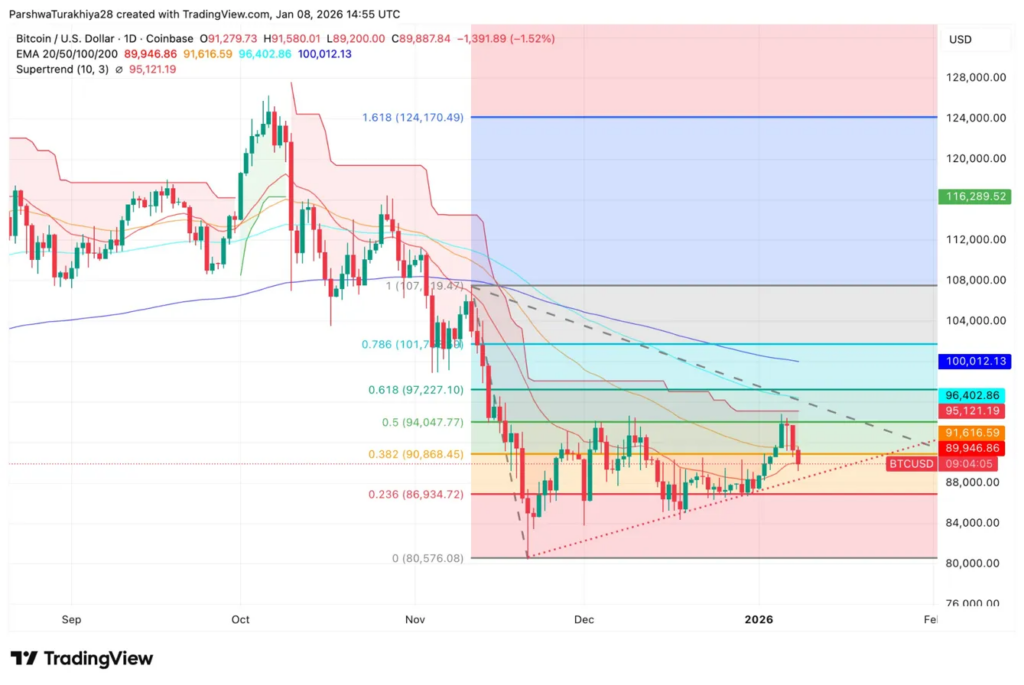
BTC Price Dynamics By TradingView
Bitcoin rallied 11.5% from the November low of $80,576 to $94,000 in early January before reversing sharply, losing $4,100 in just three days.
The breakdown below wedge support that had held since December signals a failed bullish continuation.
Price broke below the 0.382 Fibonacci at $90,868 and is testing the 20 EMA at $89,946, which represents the last line of defense before a cascade toward lower support levels.
The Supertrend remains bearish at $95,121, sitting well above price as resistance.
All higher timeframe EMAs continue to cap upside: 50 EMA at $91,616, 100 EMA at $96,402, and 200 EMA at $100,012.
Multiple failed attempts to reclaim $94,000 created a lower high structure that confirms weakening momentum.
McGlone’s $50,000 target represents a 44% decline from current levels, but it’s not a crash call—it’s a reversion thesis.
Key Levels To Watch
Immediate support: $89,946 (20 EMA), then $86,934 (0.236 Fib). Breaking $86,000 targets the November low at $80,576 with potential extension to $76,000-$78,000.
Resistance levels: Must reclaim $91,616 (50 EMA) to stabilize. Beyond that, $94,007 (0.5 Fib), then $96,402 (100 EMA). Clearing $100,000 (200 EMA) would restore bullish structure.
Image: Shutterstock
Recent Comments