In the dynamic and fiercely competitive business environment, conducting a thorough analysis of companies is crucial for investors and industry enthusiasts. In this article, we will perform an extensive industry comparison, evaluating Airbnb (NASDAQ:ABNB) in relation to its major competitors in the Hotels, Restaurants & Leisure industry. By closely examining crucial financial metrics, market position, and growth prospects, we aim to offer valuable insights for investors and shed light on company’s performance within the industry.
Airbnb Background
Started in 2008, Airbnb is the world’s largest online alternative accommodation travel agency; it also offers booking services for boutique hotels and experiences. Airbnb’s platform offered over 8 million active accommodation listings as of Dec. 31, 2024. Listings from the company’s 5 million-plus hosts are spread over almost every country in the world. In 2024, 45% of revenue was from North America, 37% from Europe, the Middle East, and Africa, 9% from Latin America, and 9% from Asia-Pacific. Transaction fees for online bookings account for all its revenue.
| Company | P/E | P/B | P/S | ROE | EBITDA (in billions) | Gross Profit (in billions) | Revenue Growth |
|---|---|---|---|---|---|---|---|
| Airbnb Inc | 32.86 | 9.72 | 7.26 | 16.76% | $1.62 | $3.55 | 9.73% |
| Royal Caribbean Group | 20.04 | 8.05 | 4.70 | 16.35% | $2.26 | $2.66 | 5.18% |
| Trip.com Group Ltd | 20.54 | 2.07 | 6.47 | 12.56% | $23.28 | $14.98 | 15.53% |
| Carnival Corp | 15.99 | 3.45 | 1.70 | 3.49% | $2.89 | $3.77 | -22.36% |
| Carnival PLC | 15.85 | 3.42 | 1.69 | 3.49% | $2.17 | $3.05 | -22.36% |
| Expedia Group Inc | 28.83 | 27.42 | 2.79 | 88.27% | $1.42 | $4.04 | 8.67% |
| Viking Holdings Ltd | 34.62 | 41.06 | 5.38 | 95.6% | $0.7 | $0.94 | 19.12% |
| H World Group Ltd | 29.90 | 9.21 | 4.76 | 12.22% | $2.55 | $2.9 | 8.06% |
| Norwegian Cruise Line Holdings Ltd | 17.12 | 4.94 | 1.25 | 22.29% | $1.04 | $1.38 | 4.69% |
| MakeMyTrip Ltd | 122.74 | 311.34 | 9.20 | -13.69% | $0.05 | $0.18 | 8.7% |
| Atour Lifestyle Holdings Ltd | 28.13 | 11.07 | 4.56 | 13.54% | $0.68 | $1.15 | 38.42% |
| Choice Hotels International Inc | 12.91 | 32.34 | 3.07 | 290.02% | $0.26 | $0.24 | 4.53% |
| Global Business Travel Group Inc | 834 | 2.86 | 1.58 | -4.54% | $0.03 | $0.4 | 12.9% |
| Hilton Grand Vacations Inc | 84.36 | 2.87 | 0.88 | 1.74% | $0.19 | $0.33 | -0.46% |
| Marriott Vacations Worldwide Corp | 13.68 | 0.88 | 0.52 | -0.08% | $0.08 | $0.45 | -3.22% |
| Average | 91.34 | 32.93 | 3.47 | 38.66% | $2.69 | $2.61 | 5.53% |
By carefully studying Airbnb, we can deduce the following trends:
-
The stock’s Price to Earnings ratio of 32.86 is lower than the industry average by 0.36x, suggesting potential value in the eyes of market participants.
-
With a Price to Book ratio of 9.72, significantly falling below the industry average by 0.3x, it suggests undervaluation and the possibility of untapped growth prospects.
-
The Price to Sales ratio of 7.26, which is 2.09x the industry average, suggests the stock could potentially be overvalued in relation to its sales performance compared to its peers.
-
The Return on Equity (ROE) of 16.76% is 21.9% below the industry average, suggesting potential inefficiency in utilizing equity to generate profits.
-
Compared to its industry, the company has lower Earnings Before Interest, Taxes, Depreciation, and Amortization (EBITDA) of $1.62 Billion, which is 0.6x below the industry average, potentially indicating lower profitability or financial challenges.
-
Compared to its industry, the company has higher gross profit of $3.55 Billion, which indicates 1.36x above the industry average, indicating stronger profitability and higher earnings from its core operations.
-
The company’s revenue growth of 9.73% exceeds the industry average of 5.53%, indicating strong sales performance and market outperformance.
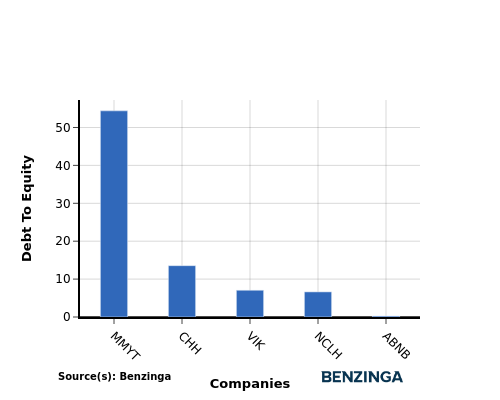
Debt To Equity Ratio

The debt-to-equity (D/E) ratio is a key indicator of a company’s financial health and its reliance on debt financing.
Considering the debt-to-equity ratio in industry comparisons allows for a concise evaluation of a company’s financial health and risk profile, aiding in informed decision-making.
By analyzing Airbnb in relation to its top 4 peers based on the Debt-to-Equity ratio, the following insights can be derived:
-
Airbnb exhibits a stronger financial position compared to its top 4 peers in the sector, as indicated by its lower debt-to-equity ratio of 0.26.
-
This suggests that the company has a more favorable balance between debt and equity, which can be seen as a positive aspect for investors.
Key Takeaways
For Airbnb in the Hotels, Restaurants & Leisure industry, the PE and PB ratios suggest the company is undervalued compared to its peers. However, the high PS ratio indicates a premium valuation based on revenue. In terms of profitability, Airbnb’s low ROE and EBITDA suggest lower returns compared to industry peers. The high gross profit and revenue growth indicate strong operational performance and potential for future growth.
This article was generated by Benzinga’s automated content engine and reviewed by an editor.
Recent Comments