In today’s rapidly changing and highly competitive business world, it is vital for investors and industry enthusiasts to carefully assess companies. In this article, we will perform a comprehensive industry comparison, evaluating Analog Devices (NASDAQ:ADI) against its key competitors in the Semiconductors & Semiconductor Equipment industry. By analyzing important financial metrics, market position, and growth prospects, we aim to provide valuable insights for investors and shed light on company’s performance within the industry.
Analog Devices Background
Analog Devices Inc is an analog, mixed-signal, and digital-signal processing chipmaker. The firm is engaged in manufacturing converter chips, which are used to translate analog signals to digital and vice versa. The company serves tens of thousands of customers; more than half of its chip sales are to industrial and automotive end markets. ADI’s chips are also incorporated into wireless infrastructure equipment.
| Company | P/E | P/B | P/S | ROE | EBITDA (in billions) | Gross Profit (in billions) | Revenue Growth |
|---|---|---|---|---|---|---|---|
| Analog Devices Inc | 64.24 | 4.24 | 13.20 | 2.32% | $1.47 | $1.94 | 25.91% |
| NVIDIA Corp | 46.35 | 38.28 | 24.60 | 29.14% | $38.75 | $41.85 | 62.49% |
| Taiwan Semiconductor Manufacturing Co Ltd | 34.03 | 10.70 | 14.73 | 9.44% | $691.11 | $588.54 | 30.31% |
| Broadcom Inc | 72.07 | 20.05 | 26.11 | 11.02% | $9.86 | $12.25 | 28.18% |
| Micron Technology Inc | 32.65 | 6.57 | 9.16 | 9.28% | $8.35 | $7.65 | 56.65% |
| Advanced Micro Devices Inc | 112.23 | 5.74 | 10.93 | 2.06% | $2.11 | $4.78 | 35.59% |
| Qualcomm Inc | 36.42 | 9.21 | 4.55 | -12.88% | $3.51 | $6.24 | 10.03% |
| Intel Corp | 667.33 | 1.80 | 3.30 | 3.98% | $7.85 | $5.22 | 2.78% |
| Texas Instruments Inc | 34.99 | 10.50 | 10.18 | 8.21% | $2.24 | $2.72 | 14.24% |
| ARM Holdings PLC | 148.12 | 16.55 | 27.91 | 3.3% | $0.22 | $1.11 | 34.48% |
| Marvell Technology Inc | 31.07 | 5.32 | 9.84 | 13.84% | $2.58 | $1.07 | 36.83% |
| NXP Semiconductors NV | 30.40 | 6.16 | 5.20 | 6.43% | $1.11 | $1.79 | -2.37% |
| Monolithic Power Systems Inc | 25.79 | 13.50 | 18.19 | 5.12% | $0.21 | $0.41 | 18.88% |
| ASE Technology Holding Co Ltd | 35.57 | 3.79 | 1.93 | 3.56% | $32.4 | $28.88 | 5.29% |
| First Solar Inc | 20.63 | 3.20 | 5.72 | 5.19% | $0.61 | $0.61 | 79.67% |
| STMicroelectronics NV | 50.71 | 1.46 | 2.32 | 1.33% | $0.31 | $1.06 | -1.97% |
| ON Semiconductor Corp | 84.60 | 3.14 | 4.17 | 3.22% | $0.44 | $0.59 | -11.98% |
| Credo Technology Group Holding Ltd | 114.61 | 18.67 | 31.90 | 7.99% | $0.09 | $0.18 | 272.08% |
| United Microelectronics Corp | 15.14 | 1.78 | 2.68 | 4.29% | $30.07 | $17.62 | -2.25% |
| Tower Semiconductor Ltd | 70.65 | 4.83 | 9.15 | 1.9% | $0.13 | $0.09 | 6.79% |
| Lattice Semiconductor Corp | 427.43 | 16.55 | 23.87 | 0.4% | $0.01 | $0.09 | 4.92% |
| Rambus Inc | 46.19 | 8.10 | 15.55 | 3.84% | $0.08 | $0.14 | 22.68% |
| Average | 101.76 | 9.8 | 12.48 | 5.75% | $39.62 | $34.42 | 33.49% |
By analyzing Analog Devices, we can infer the following trends:
-
At 64.24, the stock’s Price to Earnings ratio is 0.63x less than the industry average, suggesting favorable growth potential.
-
With a Price to Book ratio of 4.24, significantly falling below the industry average by 0.43x, it suggests undervaluation and the possibility of untapped growth prospects.
-
The Price to Sales ratio of 13.2, which is 1.06x the industry average, suggests the stock could potentially be overvalued in relation to its sales performance compared to its peers.
-
The Return on Equity (ROE) of 2.32% is 3.43% below the industry average, suggesting potential inefficiency in utilizing equity to generate profits.
-
The company has lower Earnings Before Interest, Taxes, Depreciation, and Amortization (EBITDA) of $1.47 Billion, which is 0.04x below the industry average. This potentially indicates lower profitability or financial challenges.
-
Compared to its industry, the company has lower gross profit of $1.94 Billion, which indicates 0.06x below the industry average, potentially indicating lower revenue after accounting for production costs.
-
The company’s revenue growth of 25.91% is significantly below the industry average of 33.49%. This suggests a potential struggle in generating increased sales volume.
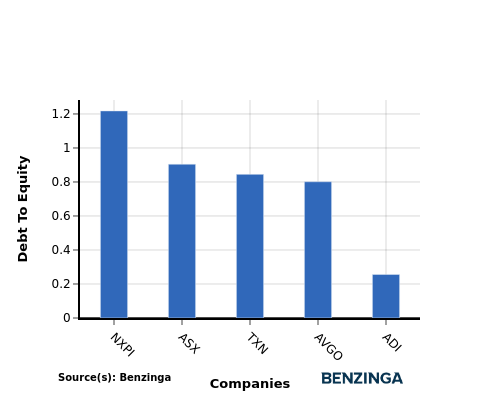
Debt To Equity Ratio

The debt-to-equity (D/E) ratio gauges the extent to which a company has financed its operations through debt relative to equity.
Considering the debt-to-equity ratio in industry comparisons allows for a concise evaluation of a company’s financial health and risk profile, aiding in informed decision-making.
By evaluating Analog Devices against its top 4 peers in terms of the Debt-to-Equity ratio, the following observations arise:
-
Analog Devices is in a relatively stronger financial position compared to its top 4 peers, as evidenced by its lower debt-to-equity ratio of 0.26.
-
This implies that the company relies less on debt financing and has a more favorable balance between debt and equity.
Key Takeaways
For Analog Devices, the PE and PB ratios are low compared to peers, indicating potential undervaluation. However, the high PS ratio suggests overvaluation based on revenue. The low ROE, EBITDA, gross profit, and revenue growth further indicate underperformance compared to industry peers in the semiconductor sector.
This article was generated by Benzinga’s automated content engine and reviewed by an editor.
Recent Comments