In the fast-paced and cutthroat world of business, conducting thorough company analysis is essential for investors and industry experts. In this article, we will undertake a comprehensive industry comparison, evaluating Intel (NASDAQ:INTC) in comparison to its major competitors within the Semiconductors & Semiconductor Equipment industry. By analyzing crucial financial metrics, market position, and growth potential, our objective is to provide valuable insights for investors and offer a deeper understanding of company’s performance in the industry.
Intel Background
Intel is a leading digital chipmaker, focused on the design and manufacturing of microprocessors for the global personal computer and data center markets. Intel pioneered the x86 architecture for microprocessors and led the semiconductor industry down the path of Moore’s law for advances in semiconductor manufacturing. Intel remains the market share leader in central processing units in both the PC and server end markets. Intel is seeking to reinvigorate its chip manufacturing business, Intel Foundry, while developing leading-edge products within its Intel Products business segment.
| Company | P/E | P/B | P/S | ROE | EBITDA (in billions) | Gross Profit (in billions) | Revenue Growth |
|---|---|---|---|---|---|---|---|
| Intel Corp | 603.33 | 1.62 | 2.98 | 3.98% | $7.85 | $5.22 | 2.78% |
| NVIDIA Corp | 47.16 | 38.95 | 25.03 | 29.14% | $38.75 | $41.85 | 62.49% |
| Broadcom Inc | 73.82 | 20.54 | 26.75 | 11.02% | $9.86 | $12.25 | 28.18% |
| Taiwan Semiconductor Manufacturing Co Ltd | 31.49 | 9.90 | 13.63 | 9.44% | $691.11 | $588.54 | 30.31% |
| Advanced Micro Devices Inc | 112.56 | 5.76 | 10.96 | 2.06% | $2.11 | $4.78 | 35.59% |
| Micron Technology Inc | 27.07 | 5.45 | 7.60 | 9.28% | $8.35 | $7.65 | 56.65% |
| Qualcomm Inc | 34.89 | 8.83 | 4.36 | -12.88% | $3.51 | $6.24 | 10.03% |
| Texas Instruments Inc | 32.22 | 9.67 | 9.38 | 8.21% | $2.24 | $2.72 | 14.24% |
| Analog Devices Inc | 60.71 | 4.01 | 12.48 | 2.32% | $1.47 | $1.94 | 25.91% |
| ARM Holdings PLC | 141.37 | 15.80 | 26.64 | 3.3% | $0.22 | $1.11 | 34.48% |
| Marvell Technology Inc | 30.40 | 5.21 | 9.63 | 13.84% | $2.58 | $1.07 | 36.83% |
| NXP Semiconductors NV | 27.55 | 5.58 | 4.72 | 6.43% | $1.11 | $1.79 | -2.37% |
| Monolithic Power Systems Inc | 24.28 | 12.71 | 17.12 | 5.12% | $0.21 | $0.41 | 18.88% |
| ASE Technology Holding Co Ltd | 31.97 | 3.41 | 1.74 | 3.56% | $32.4 | $28.88 | 5.29% |
| First Solar Inc | 20.70 | 3.21 | 5.74 | 5.19% | $0.61 | $0.61 | 79.67% |
| Credo Technology Group Holding Ltd | 124.85 | 20.34 | 34.75 | 7.99% | $0.09 | $0.18 | 272.08% |
| STMicroelectronics NV | 45.24 | 1.31 | 2.07 | 1.33% | $0.31 | $1.06 | -1.97% |
| ON Semiconductor Corp | 75.25 | 2.80 | 3.71 | 3.22% | $0.44 | $0.59 | -11.98% |
| United Microelectronics Corp | 14.96 | 1.76 | 2.65 | 4.29% | $30.07 | $17.62 | -2.25% |
| Tower Semiconductor Ltd | 70.29 | 4.79 | 9.11 | 1.9% | $0.13 | $0.09 | 6.79% |
| Lattice Semiconductor Corp | 380.90 | 14.75 | 21.27 | 0.4% | $0.01 | $0.09 | 4.92% |
| Rambus Inc | 44.81 | 7.86 | 15.09 | 3.84% | $0.08 | $0.14 | 22.68% |
| Average | 69.17 | 9.65 | 12.59 | 5.67% | $39.32 | $34.27 | 34.59% |
Through a meticulous analysis of Intel, we can observe the following trends:
-
At 603.33, the stock’s Price to Earnings ratio significantly exceeds the industry average by 8.72x, suggesting a premium valuation relative to industry peers.
-
With a Price to Book ratio of 1.62, significantly falling below the industry average by 0.17x, it suggests undervaluation and the possibility of untapped growth prospects.
-
With a relatively low Price to Sales ratio of 2.98, which is 0.24x the industry average, the stock might be considered undervalued based on sales performance.
-
The Return on Equity (ROE) of 3.98% is 1.69% below the industry average, suggesting potential inefficiency in utilizing equity to generate profits.
-
With lower Earnings Before Interest, Taxes, Depreciation, and Amortization (EBITDA) of $7.85 Billion, which is 0.2x below the industry average, the company may face lower profitability or financial challenges.
-
The company has lower gross profit of $5.22 Billion, which indicates 0.15x below the industry average. This potentially indicates lower revenue after accounting for production costs.
-
The company is witnessing a substantial decline in revenue growth, with a rate of 2.78% compared to the industry average of 34.59%, which indicates a challenging sales environment.
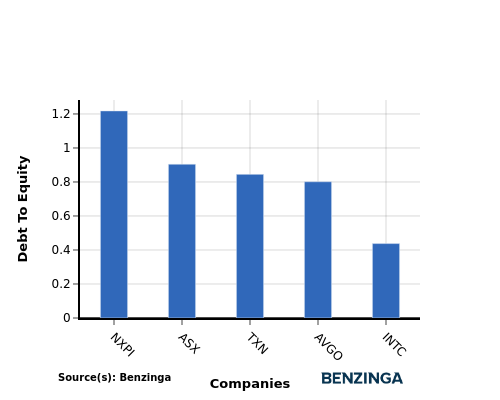
Debt To Equity Ratio

The debt-to-equity (D/E) ratio is a measure that indicates the level of debt a company has taken on relative to the value of its assets net of liabilities.
Considering the debt-to-equity ratio in industry comparisons allows for a concise evaluation of a company’s financial health and risk profile, aiding in informed decision-making.
When comparing Intel with its top 4 peers based on the Debt-to-Equity ratio, the following insights can be observed:
-
Among its top 4 peers, Intel has a stronger financial position with a lower debt-to-equity ratio of 0.44.
-
This indicates that the company relies less on debt financing and maintains a more favorable balance between debt and equity, which can be viewed positively by investors.
Key Takeaways
For Intel in the Semiconductors & Semiconductor Equipment industry, the PE ratio is high compared to peers, indicating potential overvaluation. The PB and PS ratios are low, suggesting undervaluation relative to industry competitors. In terms of ROE, EBITDA, gross profit, and revenue growth, Intel lags behind its peers, reflecting weaker financial performance and growth prospects within the sector.
This article was generated by Benzinga’s automated content engine and reviewed by an editor.
Recent Comments