Davis Commodities Ltd. (NASDAQ:DTCK) surged 12.65% in after-hours trading to $0.27 on Wednesday, following the company’s release of its first-half fiscal unaudited financial results on Tuesday.
Check out the current price of DTCK stock here.
Revenue Climbs 42% Amid Margin Pressure
The Singapore-based agricultural commodity trader reported revenue of $95 million for the six months that ended June 30, up 42.1% from $66.9 million a year earlier, according to the company’s statement.
Sugar sales rose 35.4% to $60.8 million, driven by stronger liquid sugar demand in China and Brazilian sugar sales to Africa.
Net income fell 96.9% to $0.04 million from $1.3 million a year ago. Gross margin slipped to 2.8% from 4.4%, as higher raw material and logistics costs were not fully passed on to customers.
See Also: Disney Vs. Netflix: Christmas Streaming Wars And What It Means For The Stocks
Geographic Revenue Performance
Geographical breakdown of revenue for the six-month period ending June 30:
| Country | Revenue ($M) | Change (%) |
|---|---|---|
| Africa | 66.2 | +64.9% |
| China | 15.2 | +164.4% |
| Vietnam | 1.3 | -54.2% |
| Thailand | 1.6 | -81.7% |
| Singapore | 4.8 | -2.0% |
Basic and diluted earnings per share of Davis Commodities were $0.01, down from $0.05 a year earlier.
Trading Metrics, Technical Analysis
Davis Commodities has a relative strength index (RSI) of 37.26.
Over the past 12 months, DTCK has seen a dramatic decline of 78.57%, reflecting significant challenges for the company. This long-term trend underscores the need for traders to remain vigilant.
The stock has a market capitalization of $5.85 million, a 52-week high of $6.89, and a 52-week low of $0.23.
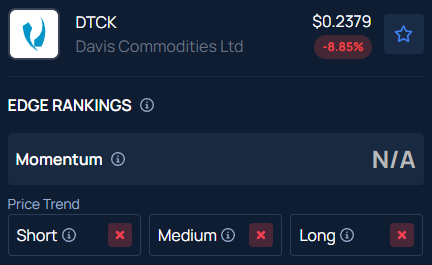
Price Action: According to Benzinga Pro data, DTCK closed on Wednesday at $0.24, down 8.85%.
The stock is currently about 0.15% above its 52-week low, placing it at the very bottom of its 52-week range. This suggests significant downward pressure, and any rally attempts may encounter strong resistance.
Benzinga’s Edge Stock Rankings indicates DTCK stock has a negative price trend across all time frames. Track the performance of other players in this segment.

Read Next:
Photo Courtesy: ST House Studio on Shutterstock.com
Disclaimer: This content was partially produced with the help of AI tools and was reviewed and published by Benzinga editors.
Recent Comments