Bitcoin’s (CRYPTO: BTC) long-term bull case is shifting from speculation to store-of-value dominance, with Kraken-backed research firm projected the cryptocurrency could climb to $1.4 million by 2035.
Store-Of-Value Model Drives $1.4 Million Target
CF Benchmarks analysts Gabriel Selby and Mark Pilipczuk said in a new report that Bitcoin will slowly take part of gold’s role as a store of value
The report outlines a three-pillar framework combining comparative store-of-value valuation, cost-of-production economics, and sensitivity to global monetary liquidity.
Today, that market is worth about $30 trillion, with gold making up the largest portion.
Analysts modeled multiple scenarios in which Bitcoin captures between 17% and 33% of gold’s market capitalization by 2035.
A probability-weighted blend of outcomes produced a base-case Bitcoin price target near $1.42 million, implying annualized returns of about 30%.
The analysts said Bitcoin offers an “asymmetrical return profile” that differentiates it from traditional asset classes, particularly as adoption broadens among institutional investors.
Rising Production Costs Reinforce Long-Term Floor
The report also looks at how much it costs to produce Bitcoin.
It treats Bitcoin like a commodity, similar to gold, where rising production costs help support price over time.
Bitcoin becomes harder to produce because of halving events, which reduce new supply every four years, and because mining difficulty increases as more computing power is used.
CF Benchmarks estimates that it currently costs about $40,000 to $50,000 to mine one Bitcoin.
The report assumes that mining growth will slow over time, hardware will keep improving, and energy costs will continue to rise.
Under those conditions, the model suggests Bitcoin’s price could exceed $1 million within the next 10 years.
Historically, periods when Bitcoin trades close to or below its production cost have often marked strong long-term buying opportunities, as prices tend to recover once mining economics tighten.
Liquidity And Volatility Trends Support Institutional Case
The report says Bitcoin’s price is closely linked to global M2 money supply, which is a measure of how much money exists in the financial system, including cash, bank deposits, and savings.
When M2 increases, it means more money is available to invest. CF Benchmarks found that Bitcoin usually moves higher a few months after M2 rises, and its price often grows faster than the money supply itself during those periods.
This helps explain why Bitcoin performs best when financial conditions are loose.
The report also says Bitcoin’s price swings are getting smaller over time.
Analysts expects Bitcoin’s volatility to fall further, reaching around 28% by 2035, down from triple-digit levels in its early years.
Selby and Pilipczuk attributed that shift to deeper liquidity, greater institutional participation, and continued maturation of derivatives markets.
They said even modest allocations could materially improve portfolio outcomes. “Even at 2% to 5% portfolio weights, Bitcoin improves long-term risk-adjusted returns and expands the efficient frontier,” the analysts wrote.
Other Industry Leaders Echo Million-Dollar Calls
CF Benchmarks is not alone in projecting seven-figure Bitcoin prices.
Coinbase Global Inc. (NASDAQ:COIN) CEO Brian Armstrong said earlier this year that Bitcoin could reach $1 million by 2030, citing regulatory clarity, growing ETF adoption, and the emergence of U.S. strategic Bitcoin reserves.
BitMEX co-founder Arthur Hayes has also floated a seven-figure target, while Eric Trump predicted a $1 million Bitcoin during remarks at a Federal Reserve-related event in August.
Strategy Inc. (NASDAQ:MSTR) CEO Phong Le has said nation-state adoption could drive a major Bitcoin buying cycle as early as 2026.
Macro Backdrop Supports Long-Term Thesis
Supporters of the long-term bullish case point to favorable macro conditions, including expanding liquidity, productivity gains tied to AI, and rising institutional comfort with digital assets.
Economist Ed Yardeni has described the U.S. economy as entering the steepest phase of a “Roaring 2020s” cycle, a backdrop historically supportive of risk assets.
Still, Bitcoin remains approx. 30% below its October ATH near $126,000, highlighting the gap between long-term projections and current market structure.
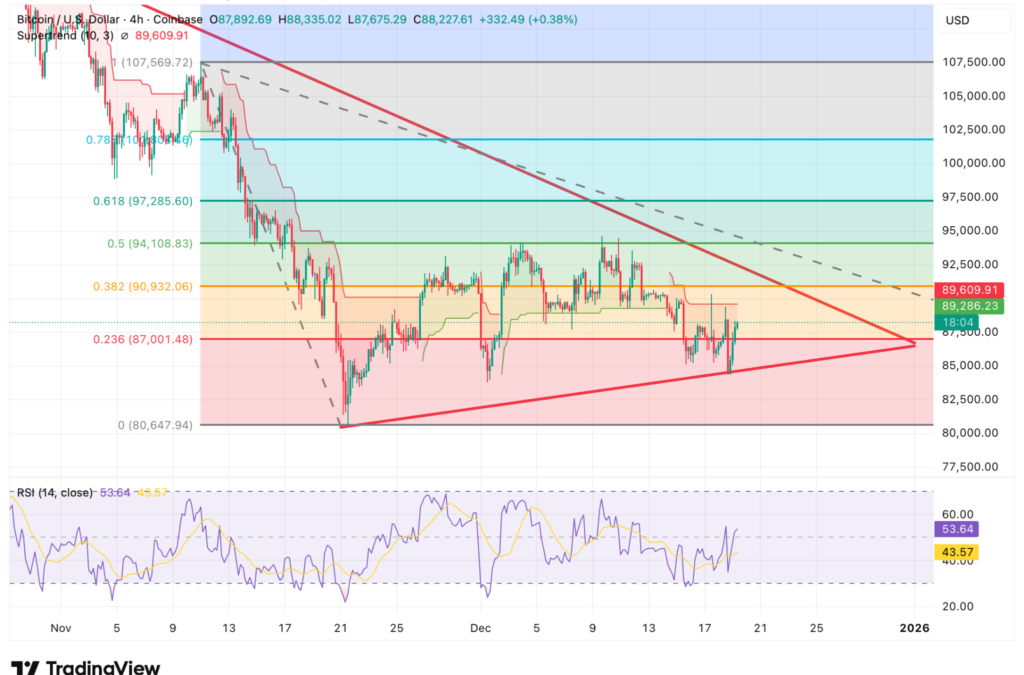
Bitcoin Chart Shows Compression Despite Bounce

BTC Price Analysis on TradingView
Bitcoin rebounded more than 3% intraday, but the broader structure remains constrained.
The $87,000 to $88,000 zone remains a key balance area, aligning with the 0.236 Fibonacci retracement.
Overhead resistance sits near $90,900 to $91,000, where the 0.382 retracement converges with a descending trendline.
Supertrend remains above price near $89,600, signaling that trend control has not flipped.
A sustained close above $91,000 would reopen the $94,000 to $97,000 zone, while a loss of $87,000 would expose the rising base near $84,000 and reintroduce downside risk.
Read Next:
Image: Shutterstock
Recent Comments